Note
: JMP Clinical employs a special protocol for data including non-unique Findings test names. Refer to
How does JMP Clinical handle non-unique Findings test names?
for more information.
Running this process with the
Nicardipine
sample setting generates the report shown below.
The
Report
contains the following elements:
|
•
|
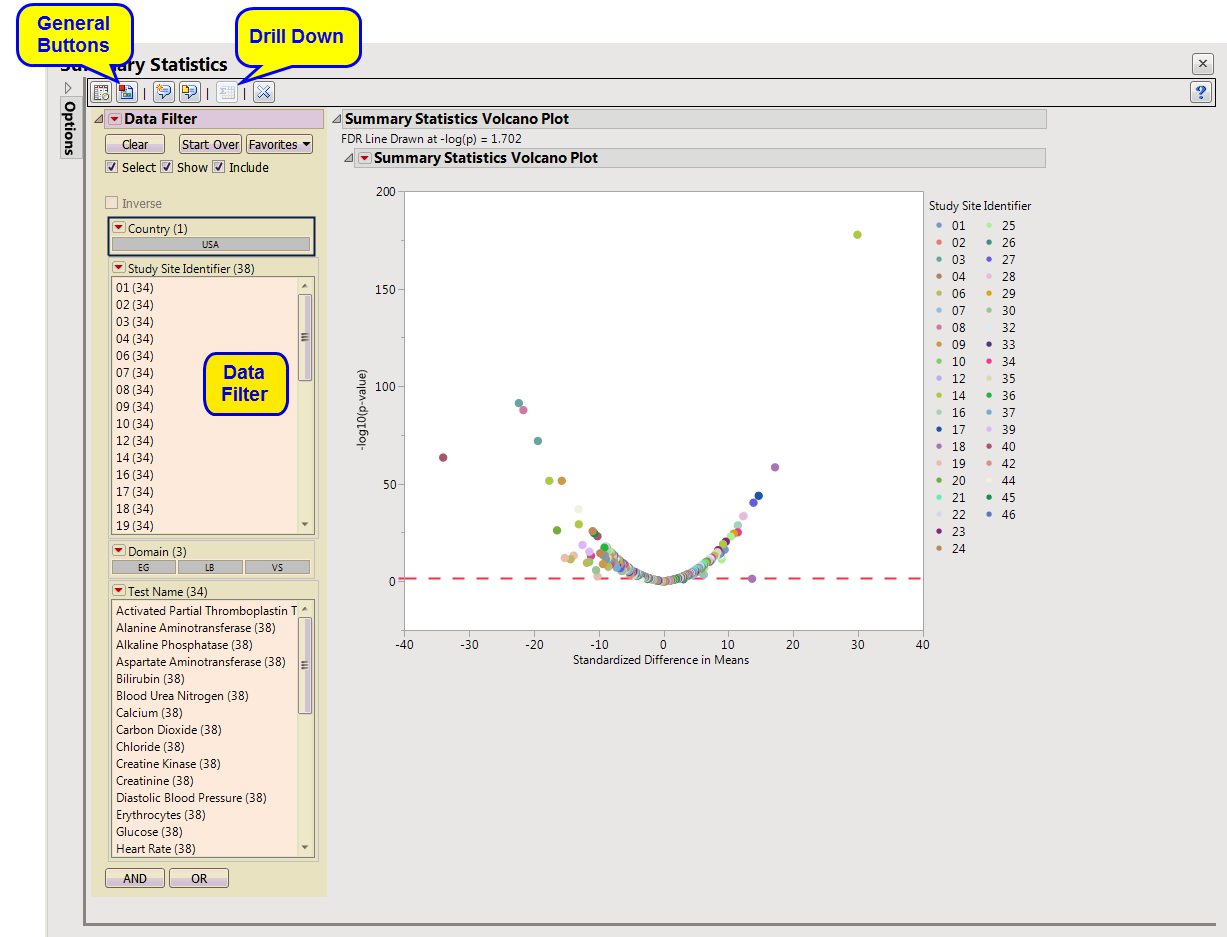
Summary Statistics Volcano Plot
: Shows a volcano plot used to determine the deviation of a mean or variance for Findings tests at a site versus other sites. Each point represents a single Findings test for a specific site. Here, the x-axis represents the standardized difference in means between each between the site and the reference set (all other sites). For comparisons of variances, the x-axis represents the log2(Ratio of Variances) between the site and the reference set.
|
|
•
|
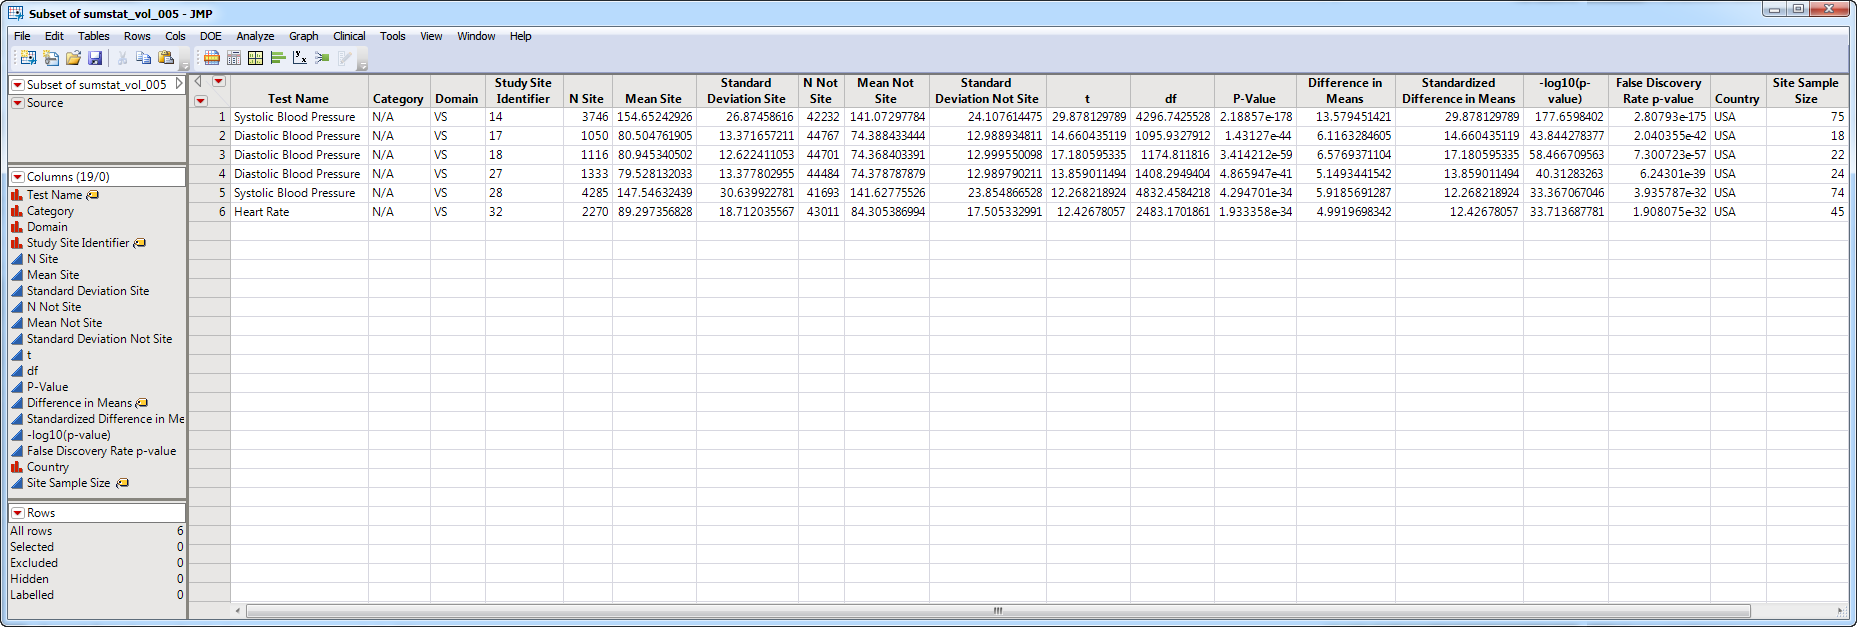
Show Summary Statistics
: Shows the rows of the data table for the selected points from the
volcano plot
. Clicking
|
|
•
|
Click
|
|
•
|
Click
|
|
•
|
Click
|
|
•
|
Click
|
|
•
|
Click the
arrow to reopen the completed process dialog used to generate this output.
|