The
Perfect Scheduled Attendance
report compares the
distribution
of study visit days for each center compared to all other centers combined, and identifies unusual differences. For example, a site where all visits occur on the same study day can be flagged for further investigation.
Running this report with the
Nicardipine
sample setting and default options generates the output shown below.
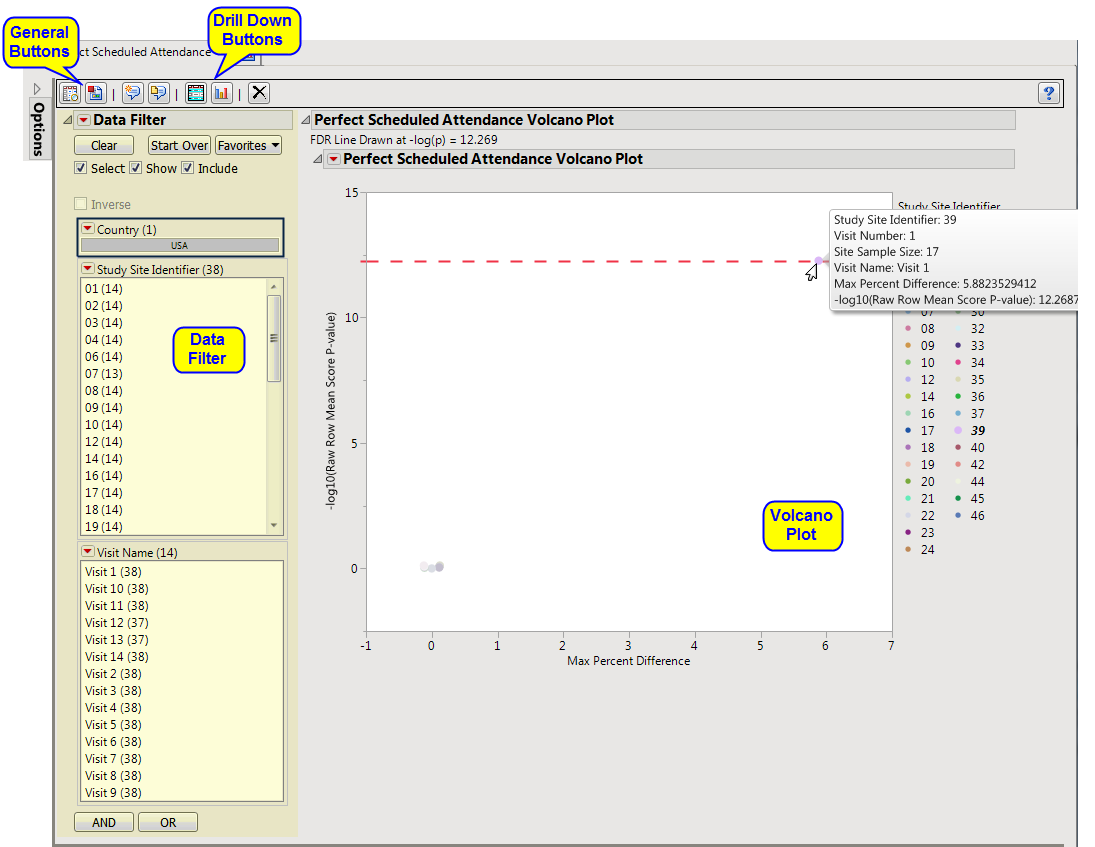
Each point represents the comparison of a site to all other sites. This comparison is used to determine whether there is a difference in
distribution
for perfect attendance and is done for all sites across all tests in all findings domains.
The
y
-axis is the
-log
10
(Row Mean Score
p-value
). Large numbers indicate statistically significant results.
The
x
-axis is the maximum percent difference across all visits between a site versus all sites.
Values far from 0 indicate important differences between a site and the reference distribution of all other sites. An
FDR
line is indicated by the dotted red line. Values above this line (Such as site 39, above) can be considered significant adjusting for multiple comparisons. This could identify rounding issues or other problems with how a site reports a particular test compared to other sites.
Note
: In the example shown above, the vast majority of the study sites (circled above) show little or no differences in Perfect attendance. In fact, the points representing these sites overlap such that individual sites cannot be differentiated at this scale.
|
•
|
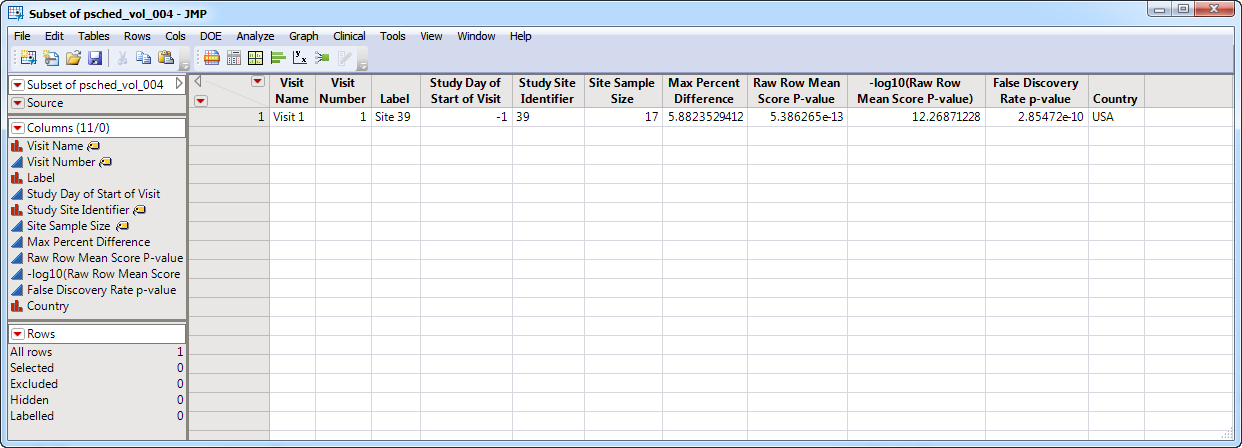
Show Sites
: Shows the rows of the data table for the selected points from the
volcano plot
.
|
|
•
|
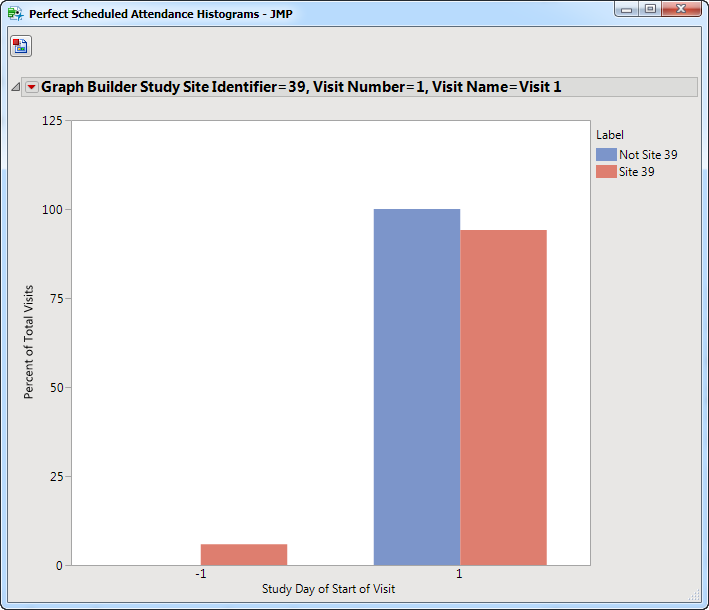
Visit Bar Charts
: For the points selected in the volcano plot, clicking
|
This enables you to subset your data based on study site and/or visit number. Refer to
Data Filter
for more information about how to use the
Data Filter
.
|
•
|
Click
|
|
•
|
Click
|
|
•
|
Click
|
|
•
|
Click
|
|
•
|
Click the
arrow to reopen the completed process dialog used to generate this output.
|