Running
Rick Based Monitoring
for the
Nicardipine
study generates the tabbed
Results
window shown below. Refer to the
Risk Based Monitoring
process description for more information. Output from the process is organized into sections. Each tab contains one or more plots, data panels, data filters, or other elements that facilitate your analysis.
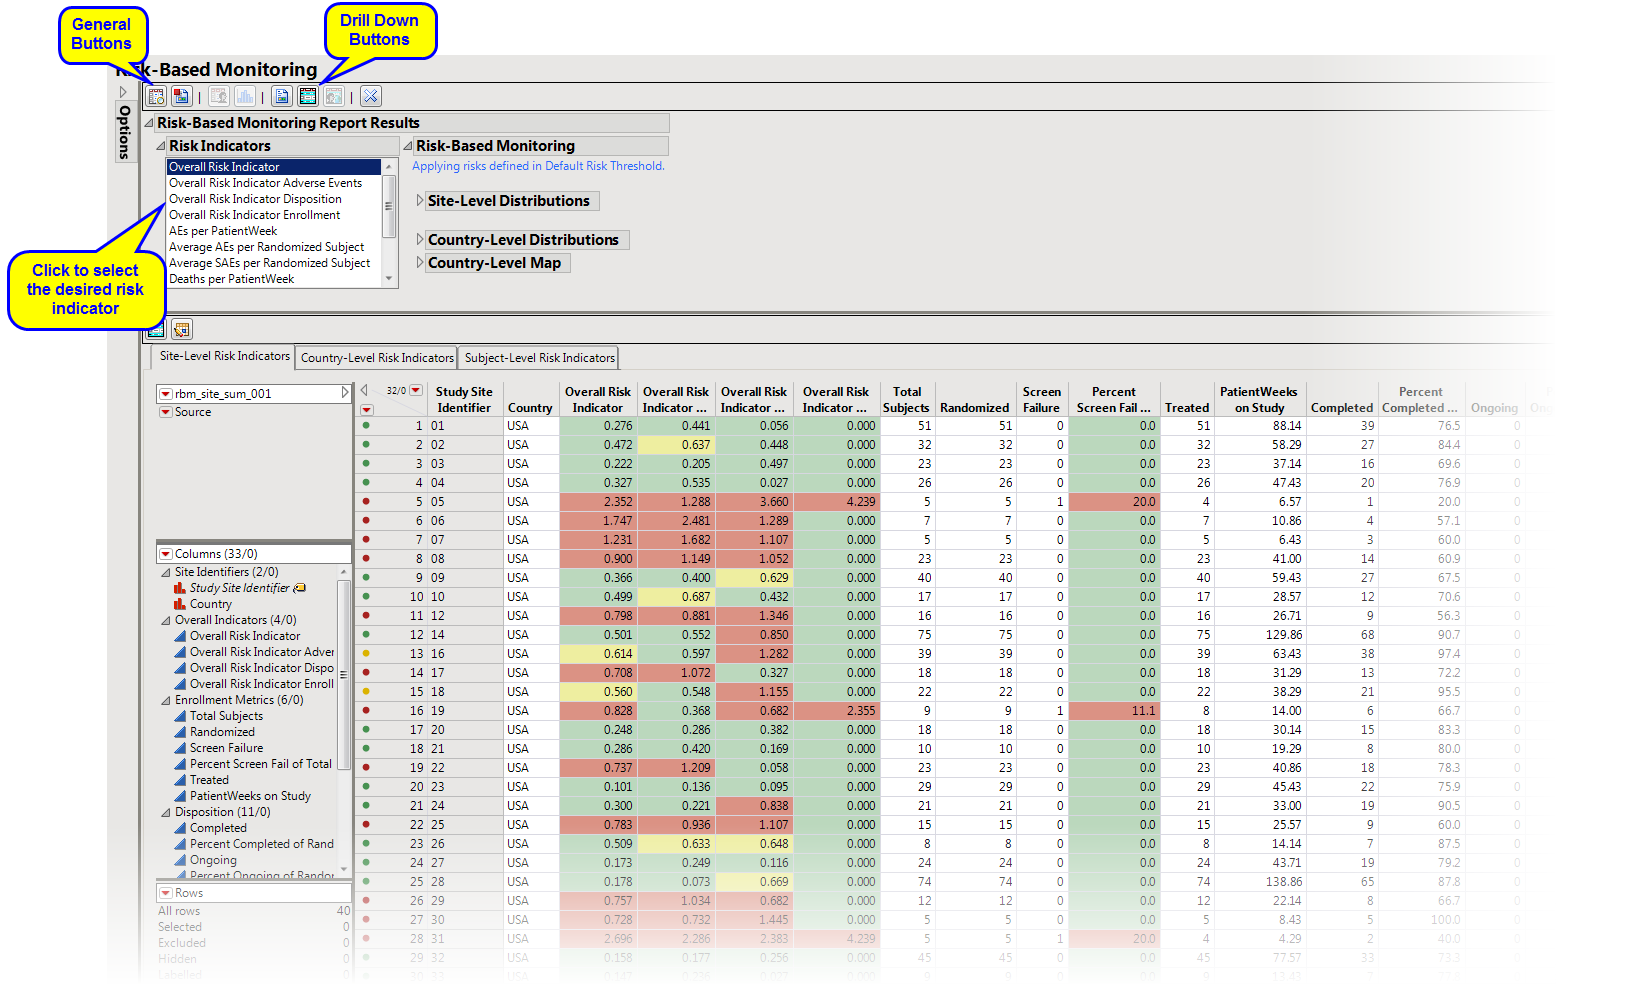
The
Report
contains the following elements:
|
•
|
Site-Level Distributions
: This section contains a series of
Histogram
s for risk indicators from the site-level risk indicators data table.
|
|
•
|
Site-Level Maps
: This section contains global and, depending on the countries present in the data, country maps detailing the location of the clinical sites based on geocoding performed in
Update Study Risk Data Set
. Site colors are based on the selected risk indicator.
Note
; This section is present only with geocoded sites.
|
|
•
|
Country-Level Distributions
: This section contains a series of
Histogram
s for risk indicators from the country-level risk indicators data table.
|
|
•
|
Country-Level Map
: This section contains global map coloring countries based on the selected risk indicator.
|
Click to highlight risk-indicator colors on data table row markers, histogram outliers, and map points.
Note:
This option is for use with indicators having defined thresholds,
|
•
|
Site-Level Data
: This data table displays risk indicators derived using the study database as well as data entered using
Update Study Risk Data Set
. Risk indicators with defined thresholds are colored in green, yellow, or red.
|
|
•
|
Country-Level Data
: This data table displays risk indicators summarized at the country level. Risk indicators with defined thresholds are colored in green, yellow, or red.
|
|
•
|
Subject Summary Data
: This data table summarizes the status of the study subjects.
|
|
•
|
Show Subjects
: Select subjects and click
|
|
•
|
Report Actions
: Click
|
|
•
|
Open Edit Checks
: Click
|
|
•
|
Select Rows Using Risk Indicators
: Click
|
|
•
|
Select Sites Using Subgroup Selection
: Click
|
|
•
|
Click
|
|
•
|
Click
|
|
•
|
Click
|
|
•
|
Click
|
|
•
|
Click the
arrow to reopen the completed process dialog used to generate this output.
|