Note
: JMP Clinical employs a special protocol for data including non-unique Findings test names. Refer to
How does JMP Clinical handle non-unique Findings test names?
for more information.
Running
Missing Findings
for the
Nicardipine
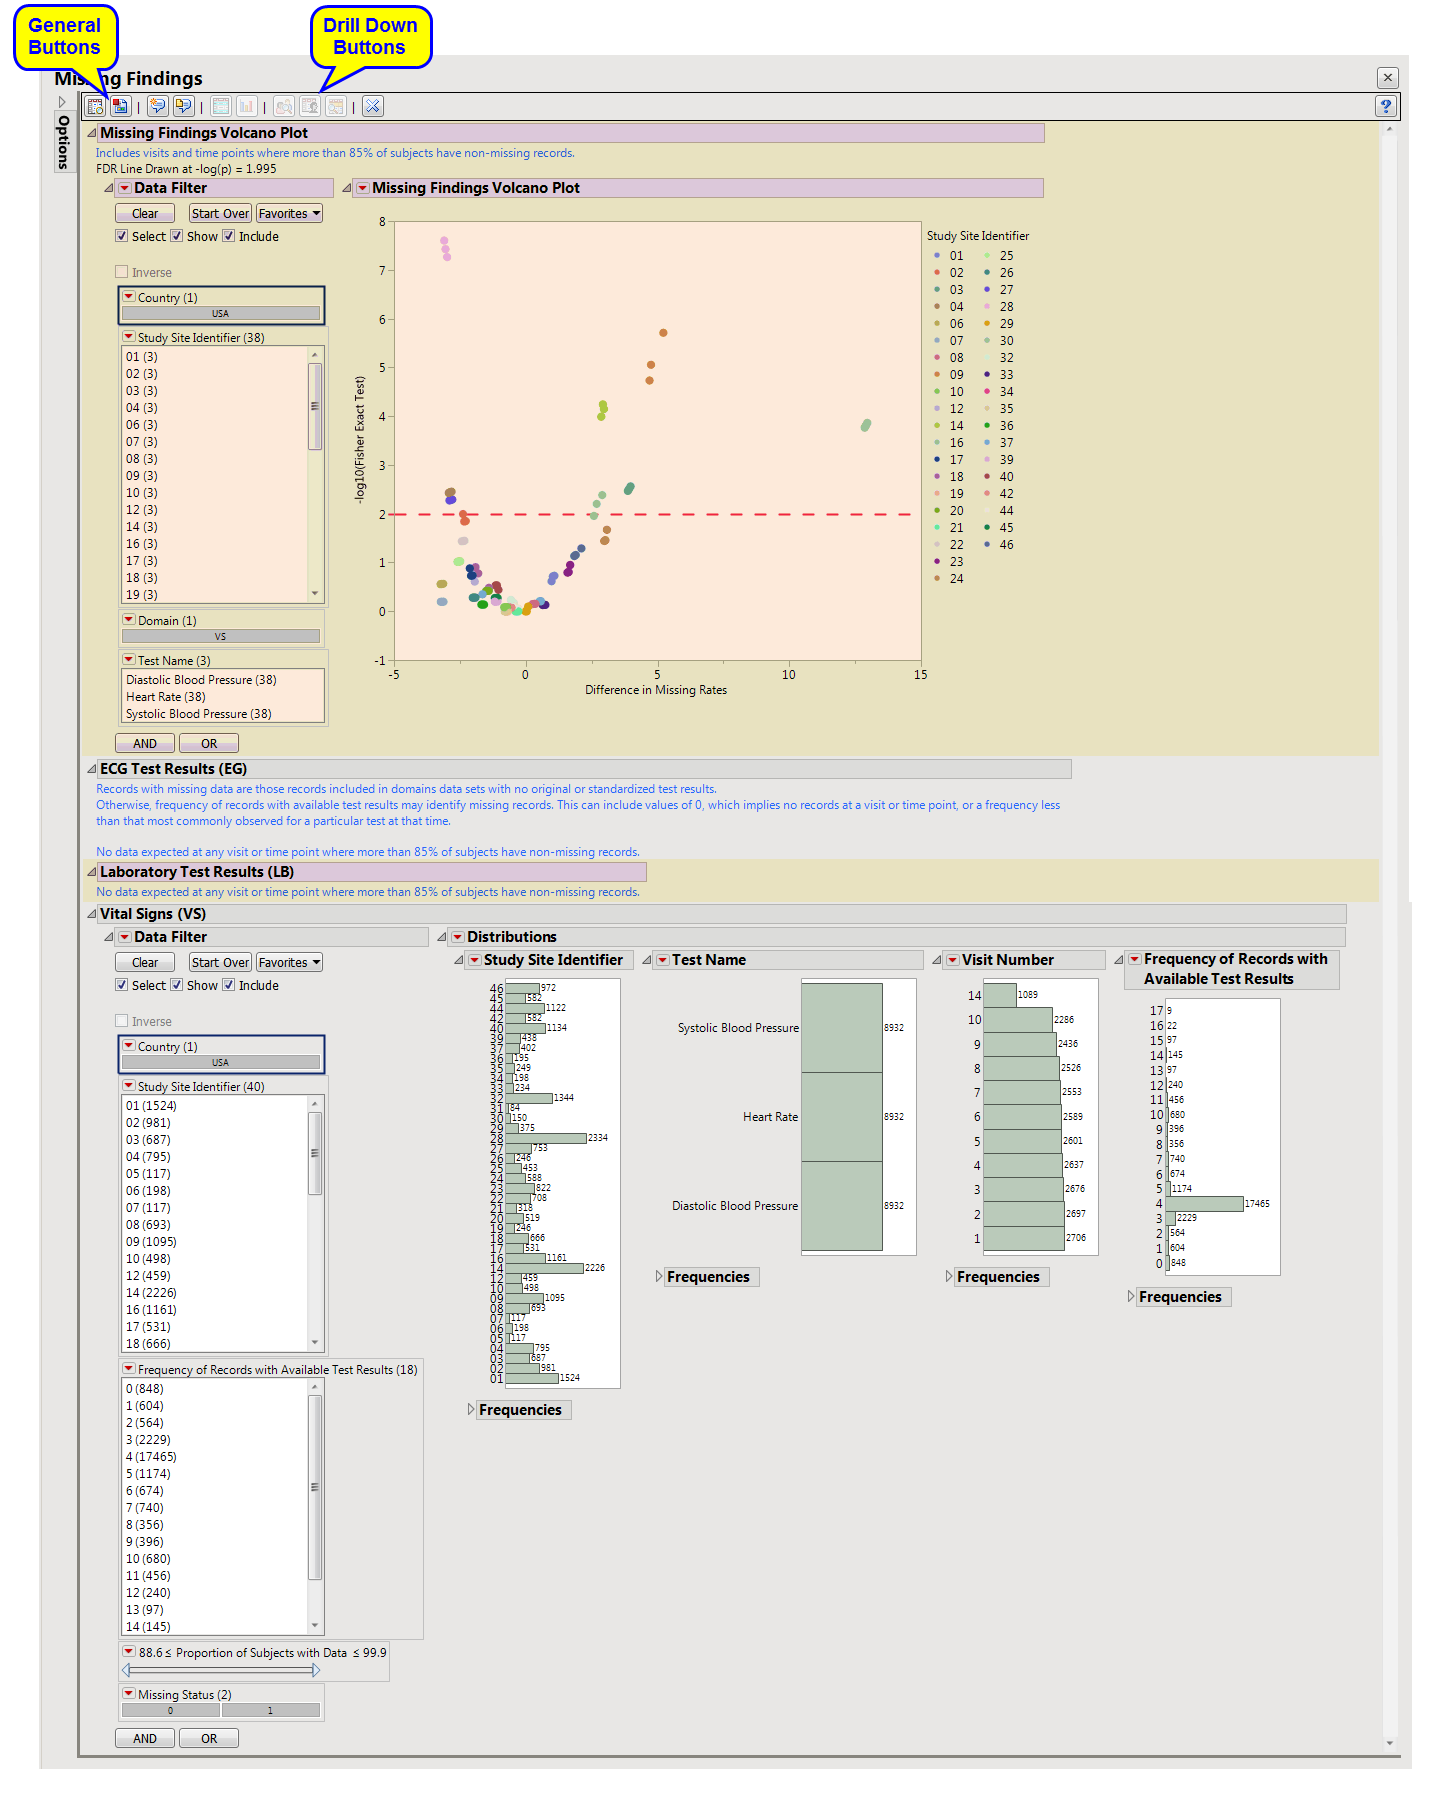
study using default settings generates the report shown below:
|
•
|
Missing Findings Volcano Plot
: Shows a volcano plot used to determine the deviation of the proportion of missing fundings results at each study site with the overall proportions for the whole study.
|
|
•
|
ECG Test Results (Missing Findings)
: Displays histograms showing distribution of ECG findings across study sites, tests, and visit numbers, as well as the frequencies of records with either available or missing results.
Note
: This test is usually not performed at every visit and so is normally not considered in this analysis. To view missing ECG results, you must reduce the threshold percentage of expected subjects and rerun the report.
|
|
•
|
Laboratory Test Results
: Displays histograms showing distribution of laboratory test findings across study sites, tests, and visit numbers, as well as the frequencies of records with either available or missing results.
Note
: This test is usually not performed at every visit and so is normally not considered in this analysis. To view missing ECG results, you must reduce the threshold percentage of expected subjects and rerun the report.
|
|
•
|
Vital Signs (Missing Findings)
: Displays histograms showing distribution of vital signs findings across study sites, tests, and visit numbers, as well as the frequencies of records with either available or missing results.
|
|
•
|
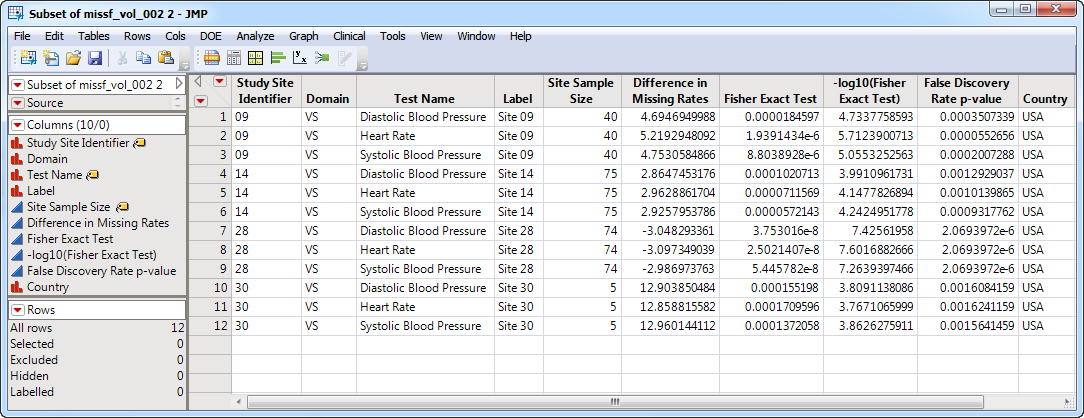
Show Sites
: Shows the rows of the data table for the selected points from the
volcano plot
. Clicking
|
|
•
|
Missing Bar Charts
: Select points on the volcano plot and click
|
|
•
|
Profile Subjects
: Select subjects and click
|
|
•
|
Show Subjects
: Select subjects and click
|
|
•
|
Show Records with Missing Test Results
: Select one or more histograms and click
|
|
•
|
Click
|
|
•
|
Click
|
|
•
|
Click
|
|
•
|
Click
|
|
•
|
Click the
arrow to reopen the completed process dialog used to generate this output.
|