Running
Correlated Findings
for
Nicardipine
using default settings generates the report shown below.
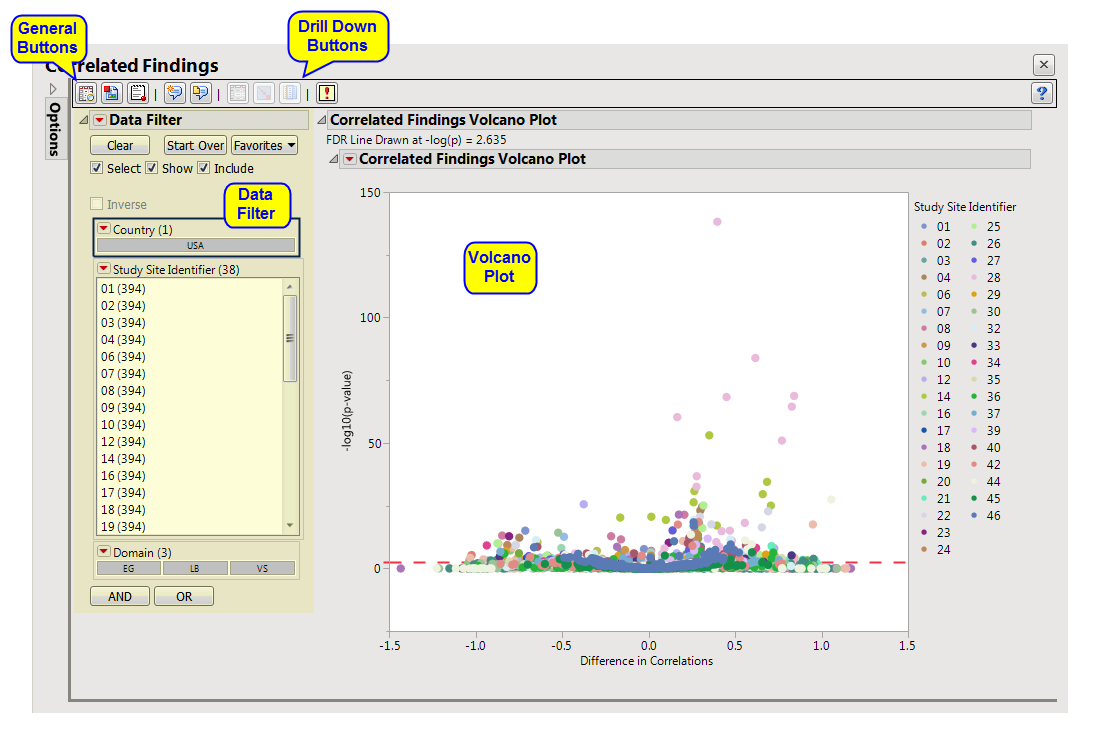
The
Report
contains the following elements:
|
•
|
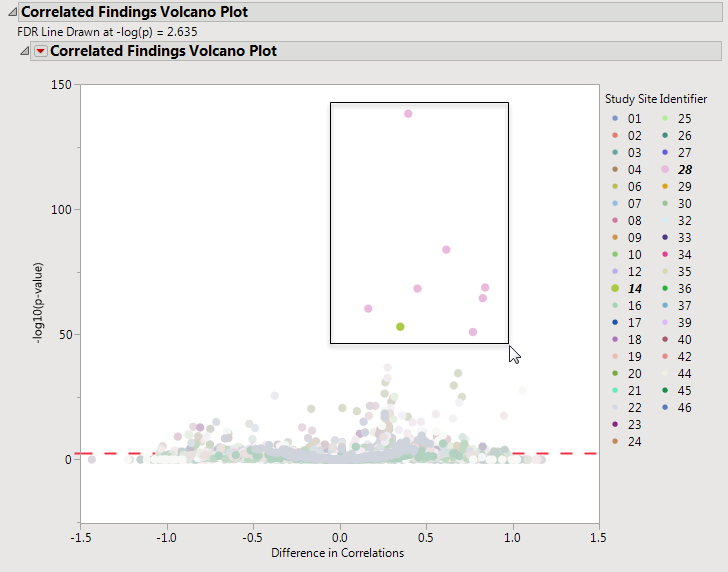
Correlated Findings Volcano Plot
: This plot show points representing the correlations between findings. Points close to zero show little or no correlation. Correlations increase the further (either positively or negatively) the further they are from zero. Selected points, in the figure below, are positively correlated.
|
|
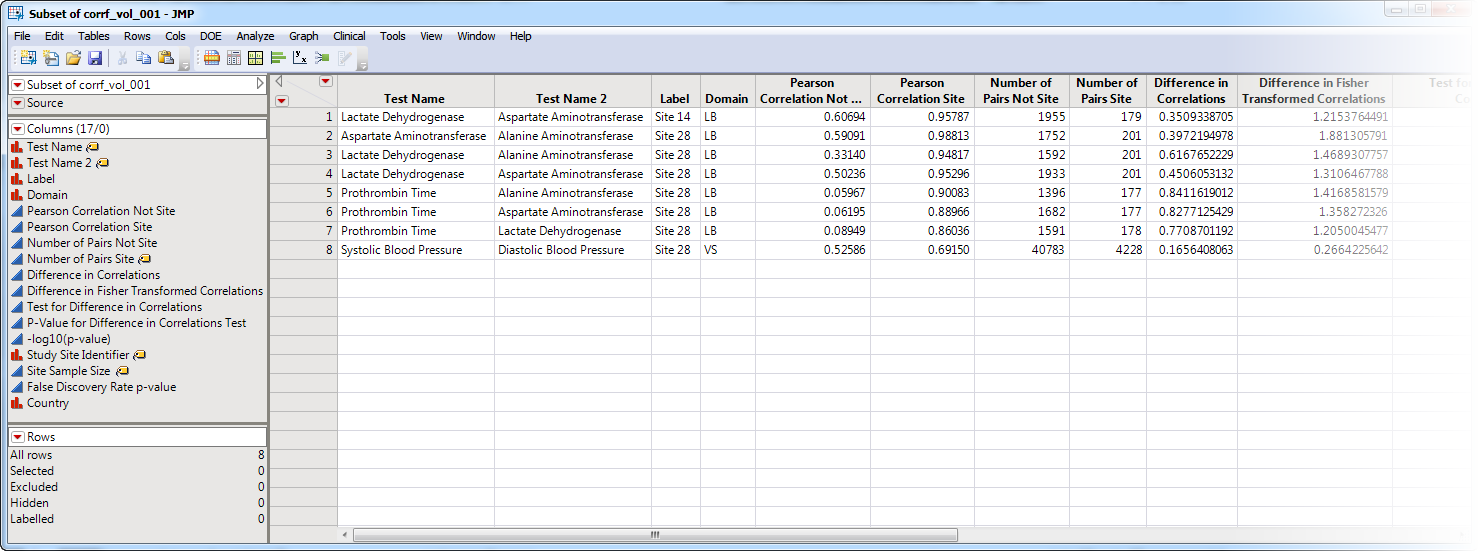
•
|
Show Sites
: Shows the rows of the data table for the selected points from the
volcano plot
. Clicking
|
|
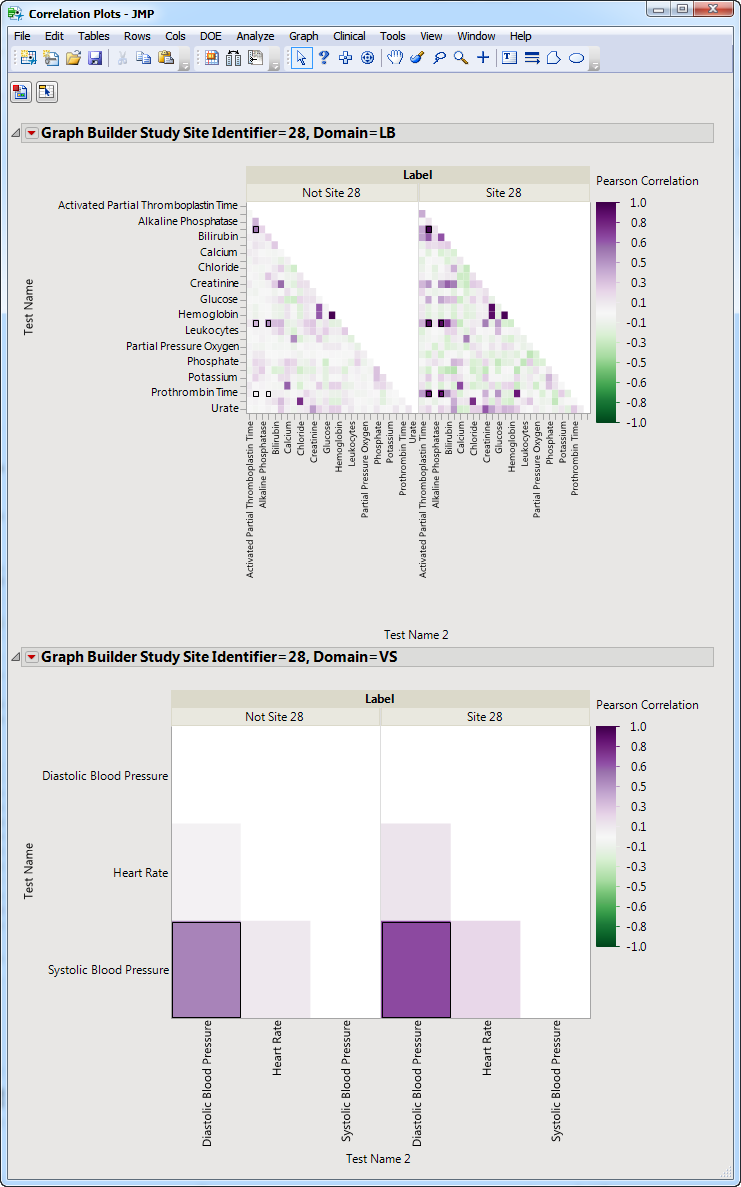
•
|
Show Correlation Plot
: Click
|
|
•
|
Show Findings
: Click
|
|
•
|
Click
|
|
•
|
Click
|
|
•
|
Click
|
|
•
|
Click
|
|
•
|
Click the
arrow to reopen the completed process dialog used to generate this output.
|