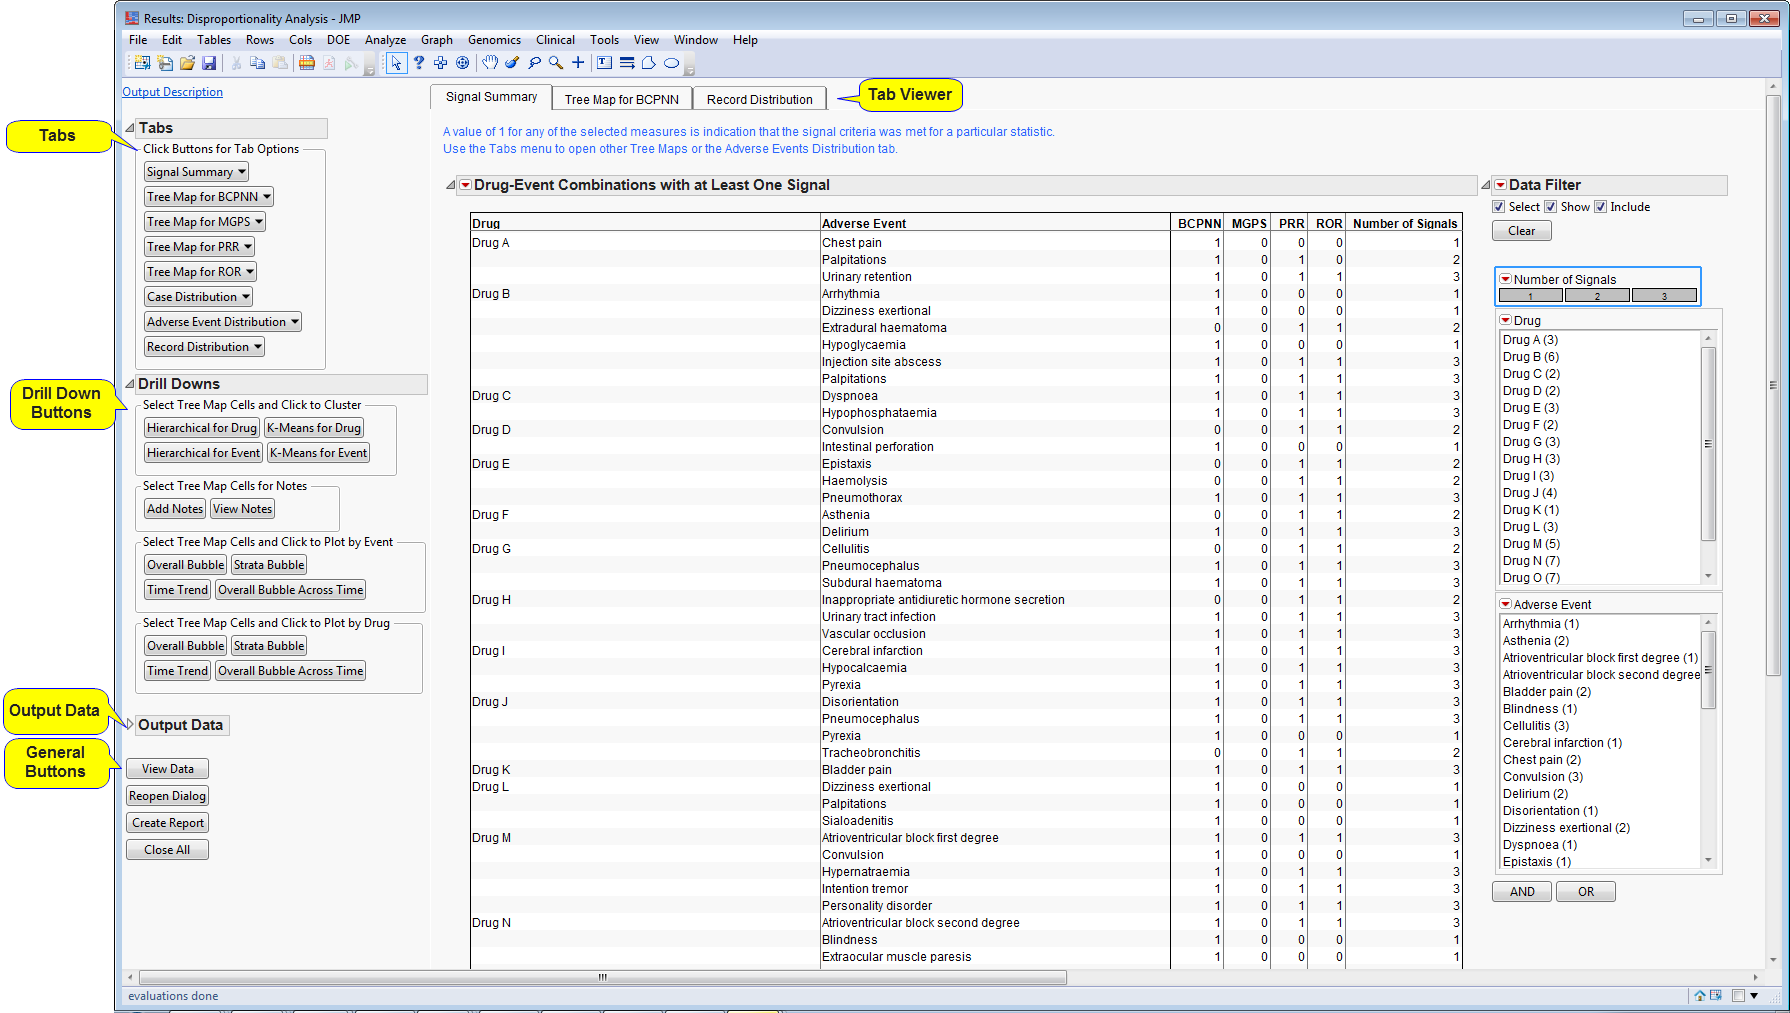
Running this process with the
pvexample
sample setting generates the tabbed
Results
window shown below. Refer to the
Disproportionality Analysis
process description for more information. Output from this process is organized into sections. Each tab contains one or more plots, data panels, data filters, or other elements that facilitate your analysis.
The
Results
window contains the following panes:
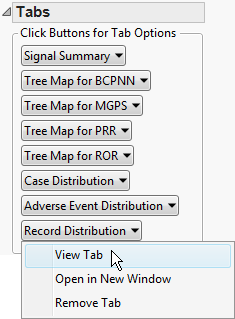
This pane enables you to access and view the output plots and associated data sets on each tab. Use the drop-down menu to view the tab in the
Tab Viewer
pane, open the tab in a new window, or remove the tab and its contents from the
Tab Viewer
pane.
|
•
|
Signal Summary
: Summarizes drug-event pairs that had a signal from at least one of the selected disproportionality statistics, and highlights any differences among the selected statistics for generating a signal.
|
|
•
|
Tree Map for BCPNN
: Uses color and size to visually highlight the magnitude of the lower limits of the 95% credible intervals for Bayesian confidence propagation neural network (BCPNN). Estimates can be plotted instead using
dialog
options.
|
|
•
|
Tree Map for MGPS
: Uses color and size to visually highlight the magnitude of the lower limits of the 95% credible intervals for multi-item gamma Poisson shrinker (
MGPS
). Estimates can be plotted instead using dialog options.
|
|
•
|
Tree Map for PRR
: Uses color and size to visually highlight the magnitude of the lower limits of the 95% confidence intervals for the proportional reporting ratio (
PRR
). Estimates can be plotted instead using dialog options.
|
|
•
|
Tree Map for ROR
: Uses color and size to visually highlight the magnitude of the lower limits of the 95% confidence intervals for the reporting odds ratio (
ROR
). Estimates can be plotted instead using dialog options.
|
|
•
|
Case Distribution
: Summary of records at the case level, which includes location and any categorical or continuous
strata variables
.
|
|
•
|
Adverse Event Distribution
: Summary of user-specified analysis
variables
at the event-level. Total
sample size
represents all unique
adverse events
.
|
|
•
|
Record Distribution
: Summary of user-specified analysis variables at the record-level. Total sample size represents all drug-event pairs across all cases.
|
|
•
|
Hierarchical for Drug
: Click
to open the
Hierarchical Clustering
dialog to cluster
drugs with similar event patterns
using the lower limits of the disproportionality statistic based on the selected cells from a
Tree Map
. Estimates can be clustered instead using dialog options.
|
|
•
|
Hierarchical for Event
: Click
to open the
Hierarchical Clustering
dialog to cluster
events with similar drug patterns
using the lower limits of the disproportionality statistic based on the selected cells from a
Tree Map
. Estimates can be clustered instead using dialog options.
|
|
•
|
K-Means for Drug
: Click
to open the
K-Means Clustering
dialog to cluster
drugs with similar event patterns
using the lower limits of the disproportionality statistic based on the selected cells from a
Tree Map
. Estimates can be clustered instead using dialog options.
|
|
•
|
K-Means for Event
: Click
to open the
K-Means Clustering
dialog to cluster
events with similar drug patterns
using the lower limits of the disproportionality statistic based on the selected cells from a
Tree Map
. Estimates can be clustered instead using dialog options.
|
|
•
|
Add Notes (Disproportionality Analysis)
or
Add Comment
(depending on version): Click
or
to save a comment for drug-event pairs selected in any
Tree Map
.
|
|
•
|
View Notes (Disproportionality Analysis)
or
View Comments
(depending on version): Click
or
to view if comments are available for drug-event pairs selected in any
Tree Map
. To see all available comments, press
-
to select all
tree map
cells.
|
|
•
|
Overall Bubble
: Click
in the
Plot by Event
panel to display disproportionality (lower limit or estimate based on dialog option) and event frequency across
all
drugs reported for selected events. Alternatively, click this button in the
Plot by Drug
panel to display disproportionality and drug frequency across
all
events reported for selected drugs.
|
|
•
|
Strata Bubble
: Click
in the
Plot by Event
panel to display disproportionality (lower limit or estimate based on dialog option) and event frequency for each
strata
across
all
drugs reported for selected events. Alternatively, click this button in the
Plot by Drug
panel to display disproportionality and drug frequency for each
strata
across
all
events reported for selected drugs. This option is available
only
if one or more strata variables are provided in the dialog.
|
|
•
|
Time Trend
: Click
in the
Plot by Event
panel to display disproportionality (lower limit or estimate based on dialog option) across time across
all
drugs reported for selected events. Alternatively, click this button in the
Plot by Drug
panel to display disproportionality across time points for
all
events reported for selected drugs. Available
only
if an event onset date is provided in the dialog. Records with missing onset dates are
not
included.
|
|
•
|
Overall Bubble Across Time
: Click
in the
Plot by Event
panel to display animation of the change in event frequency and disproportionality (lower limit or estimate based on dialog option) over time, changing color as the signal criteria is met or lost. Alternatively, click this button in the
Plot by Drug
panel to display animation of the change in drug frequency and disproportionality over time, changing color as the signal criteria is met or lost. Available
only
if an event onset date is provided in the dialog. Records with missing onset dates are
not
included.
|
|
•
|
dispanal.sas7bdat
: Contains disproportionality estimates and 95% confidence credible intervals.
time
=
Overall
results include all records for the estimates. If strata are included,
type
=
Within Strata
highlights strata-specific estimates. Other values for
time
include all records up to and including the current time period for the estimates.
|
|
•
|
Click
to reopen the completed process dialog used to generate this output.
|
|
•
|
Click
to generate a standardized
pdf
- or
rtf
-formatted report containing the plots and charts of selected tabs.
|
|
•
|
Click
to close all graphics windows and underlying data sets associated with the output.
|