|
•
|
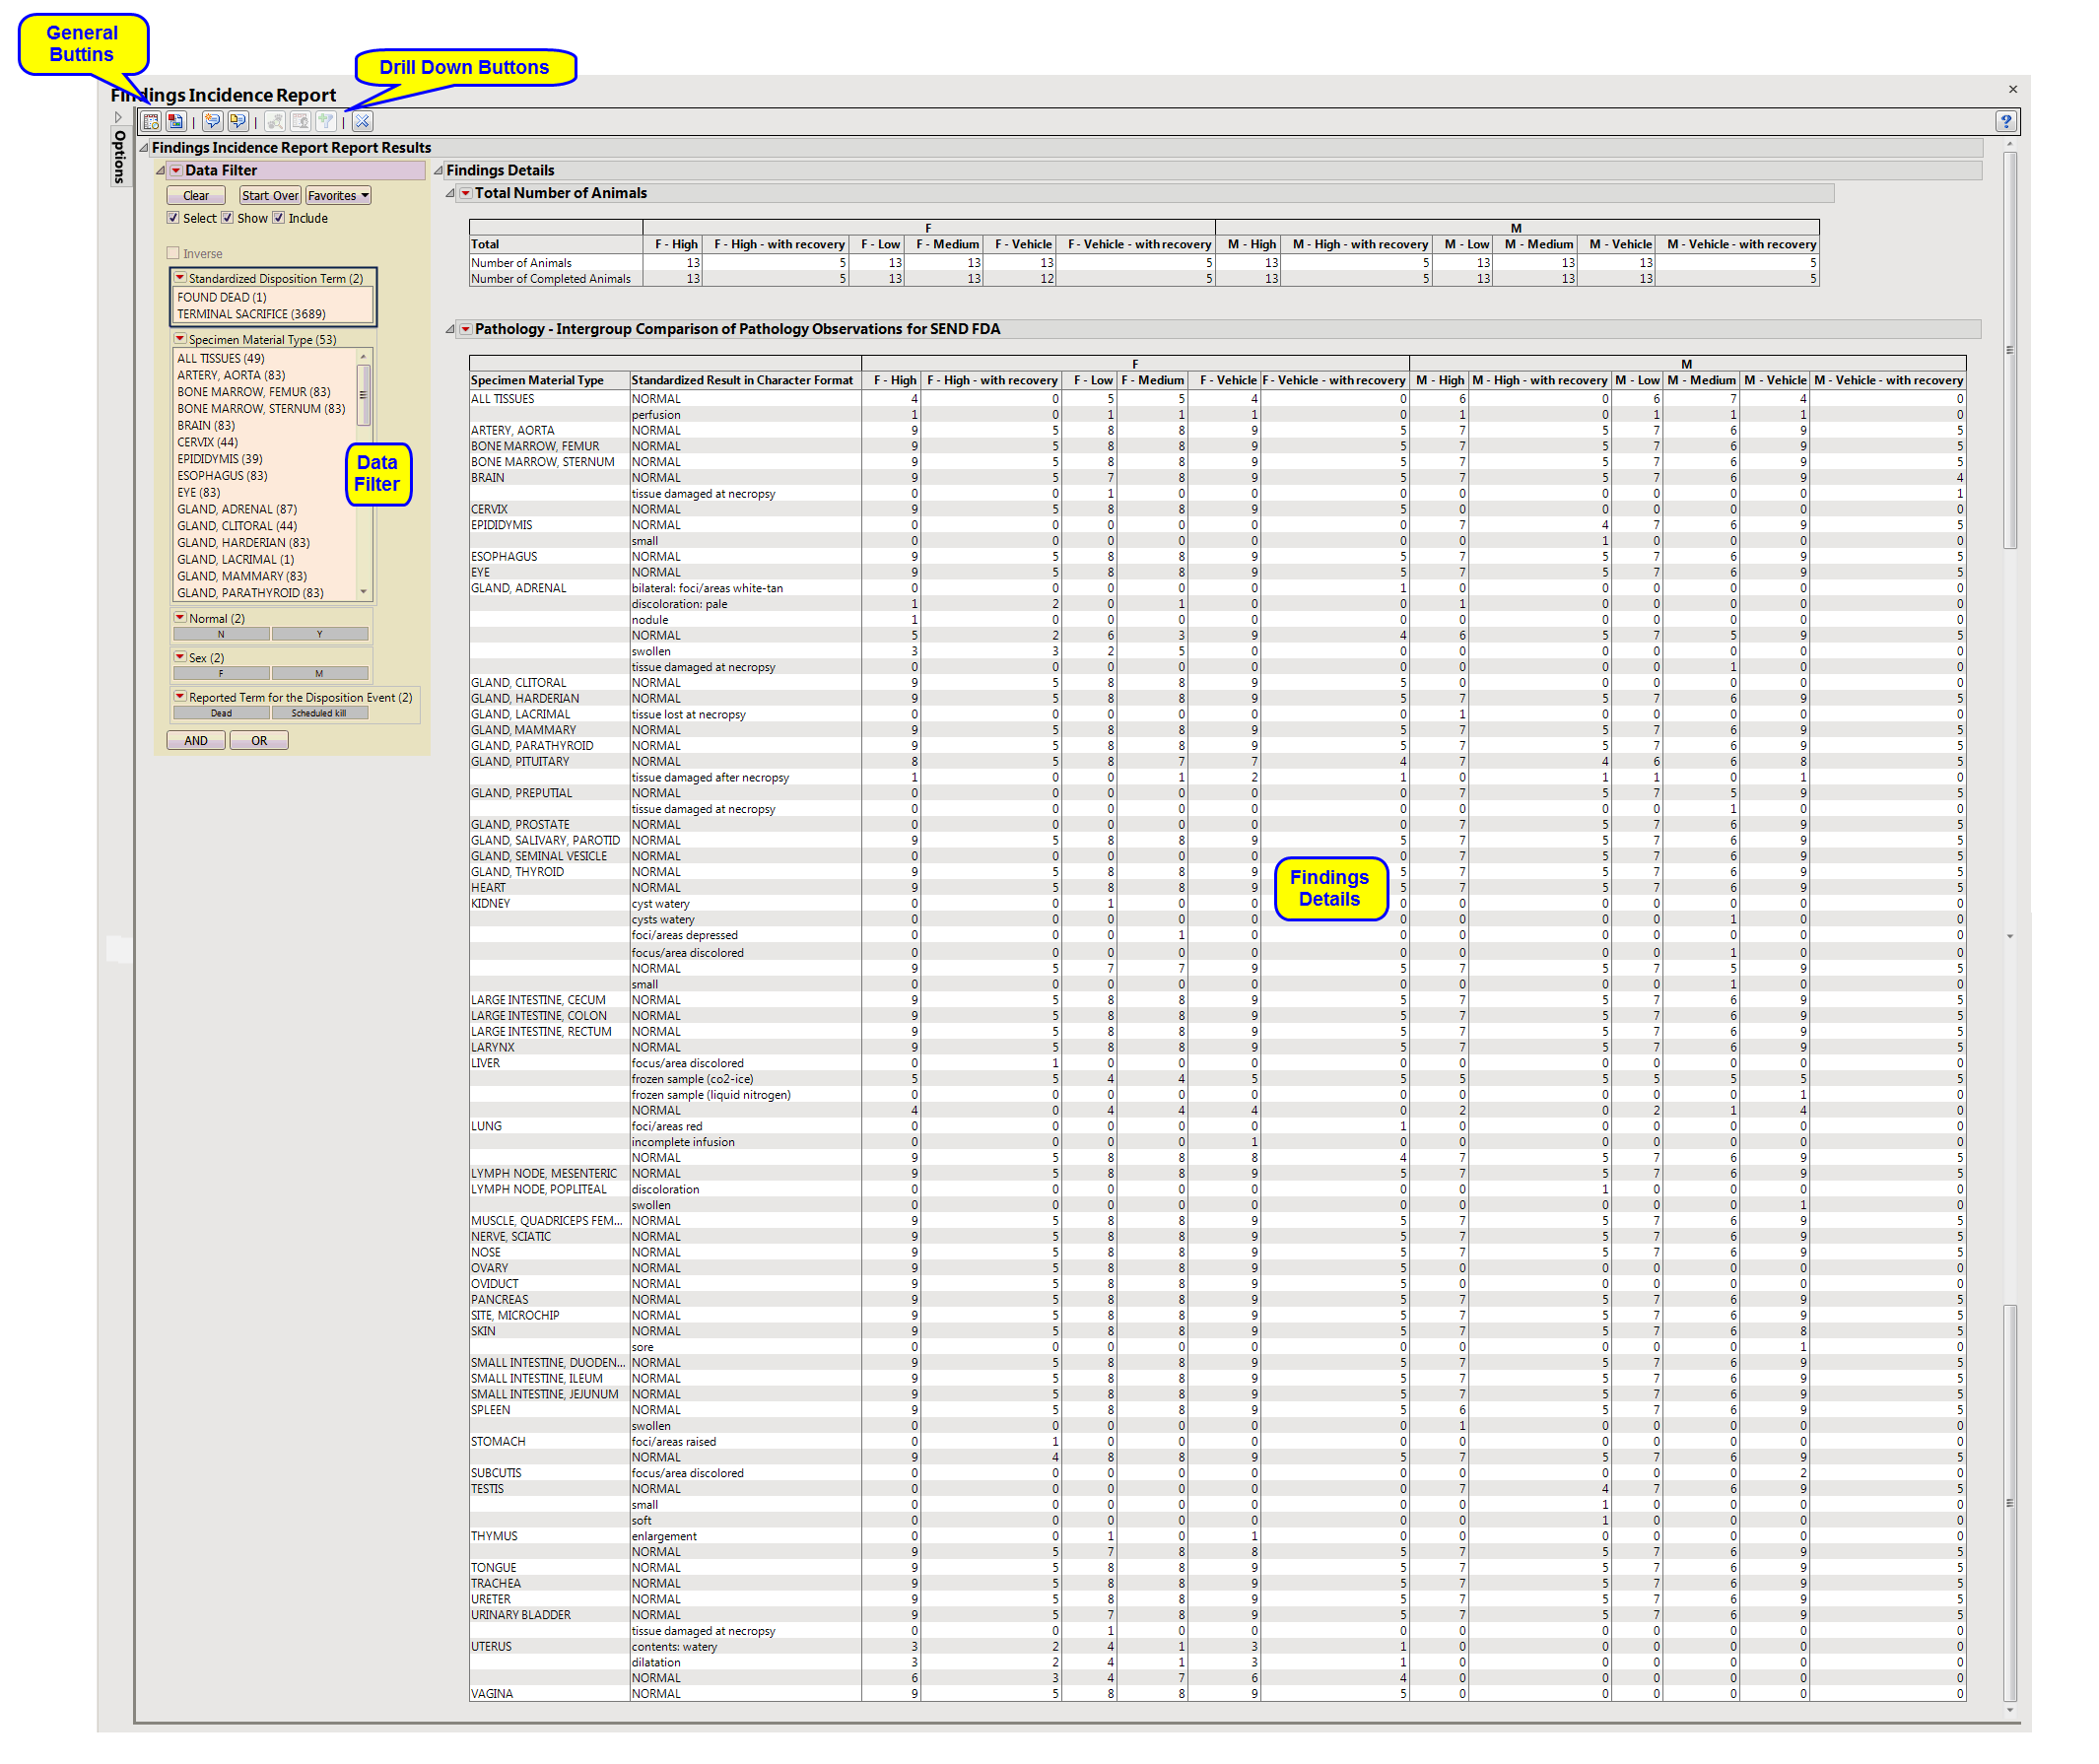
Findings Details
: Lists two tables providing details about the number, demographics and distribution of animals among the treatment groups and a high-level summary of the findings.
|
|
•
|
Data Filter
: This enables you to subset subjects based on demographic characteristics, disposition, tissue, and other factors. Refer to
Data Filter
for more information.
|
|
•
|
Profile Animals
: Generates a static report showing the profile(s) for the selected animals. You must first select one or more animals from either the
Intergroup Comparison of Pathology Operations
table or the
Specimen Type Pathology Comparison
table and then click
|
Note
: You must click
 to view the associated data tables, including the
Specimen Type Pathology Comparison
table.
to view the associated data tables, including the
Specimen Type Pathology Comparison
table.
|
•
|
Show Animals
: Select groups of animals from the
Intergroup Comparison of Pathology Operations
table or rows from the
Specimen Type Pathology Comparison
table and click
|
|
•
|
Create Animal Filter
: Click
|
|
•
|
Click
|
|
•
|
Click
|
|
•
|
Click
|
|
•
|
Click
|
|
•
|
Click the
arrow to reopen the completed process dialog used to generate this output.
|