Running this process with the
Nicardipine
sample setting generates the tabbed
Results
window shown below. Refer to the
Create Cross Domain Data
process description for more information. Output from the process is organized into sections. Each tab contains one or more plots, data panels, data filters, or other elements that facilitate your analysis.
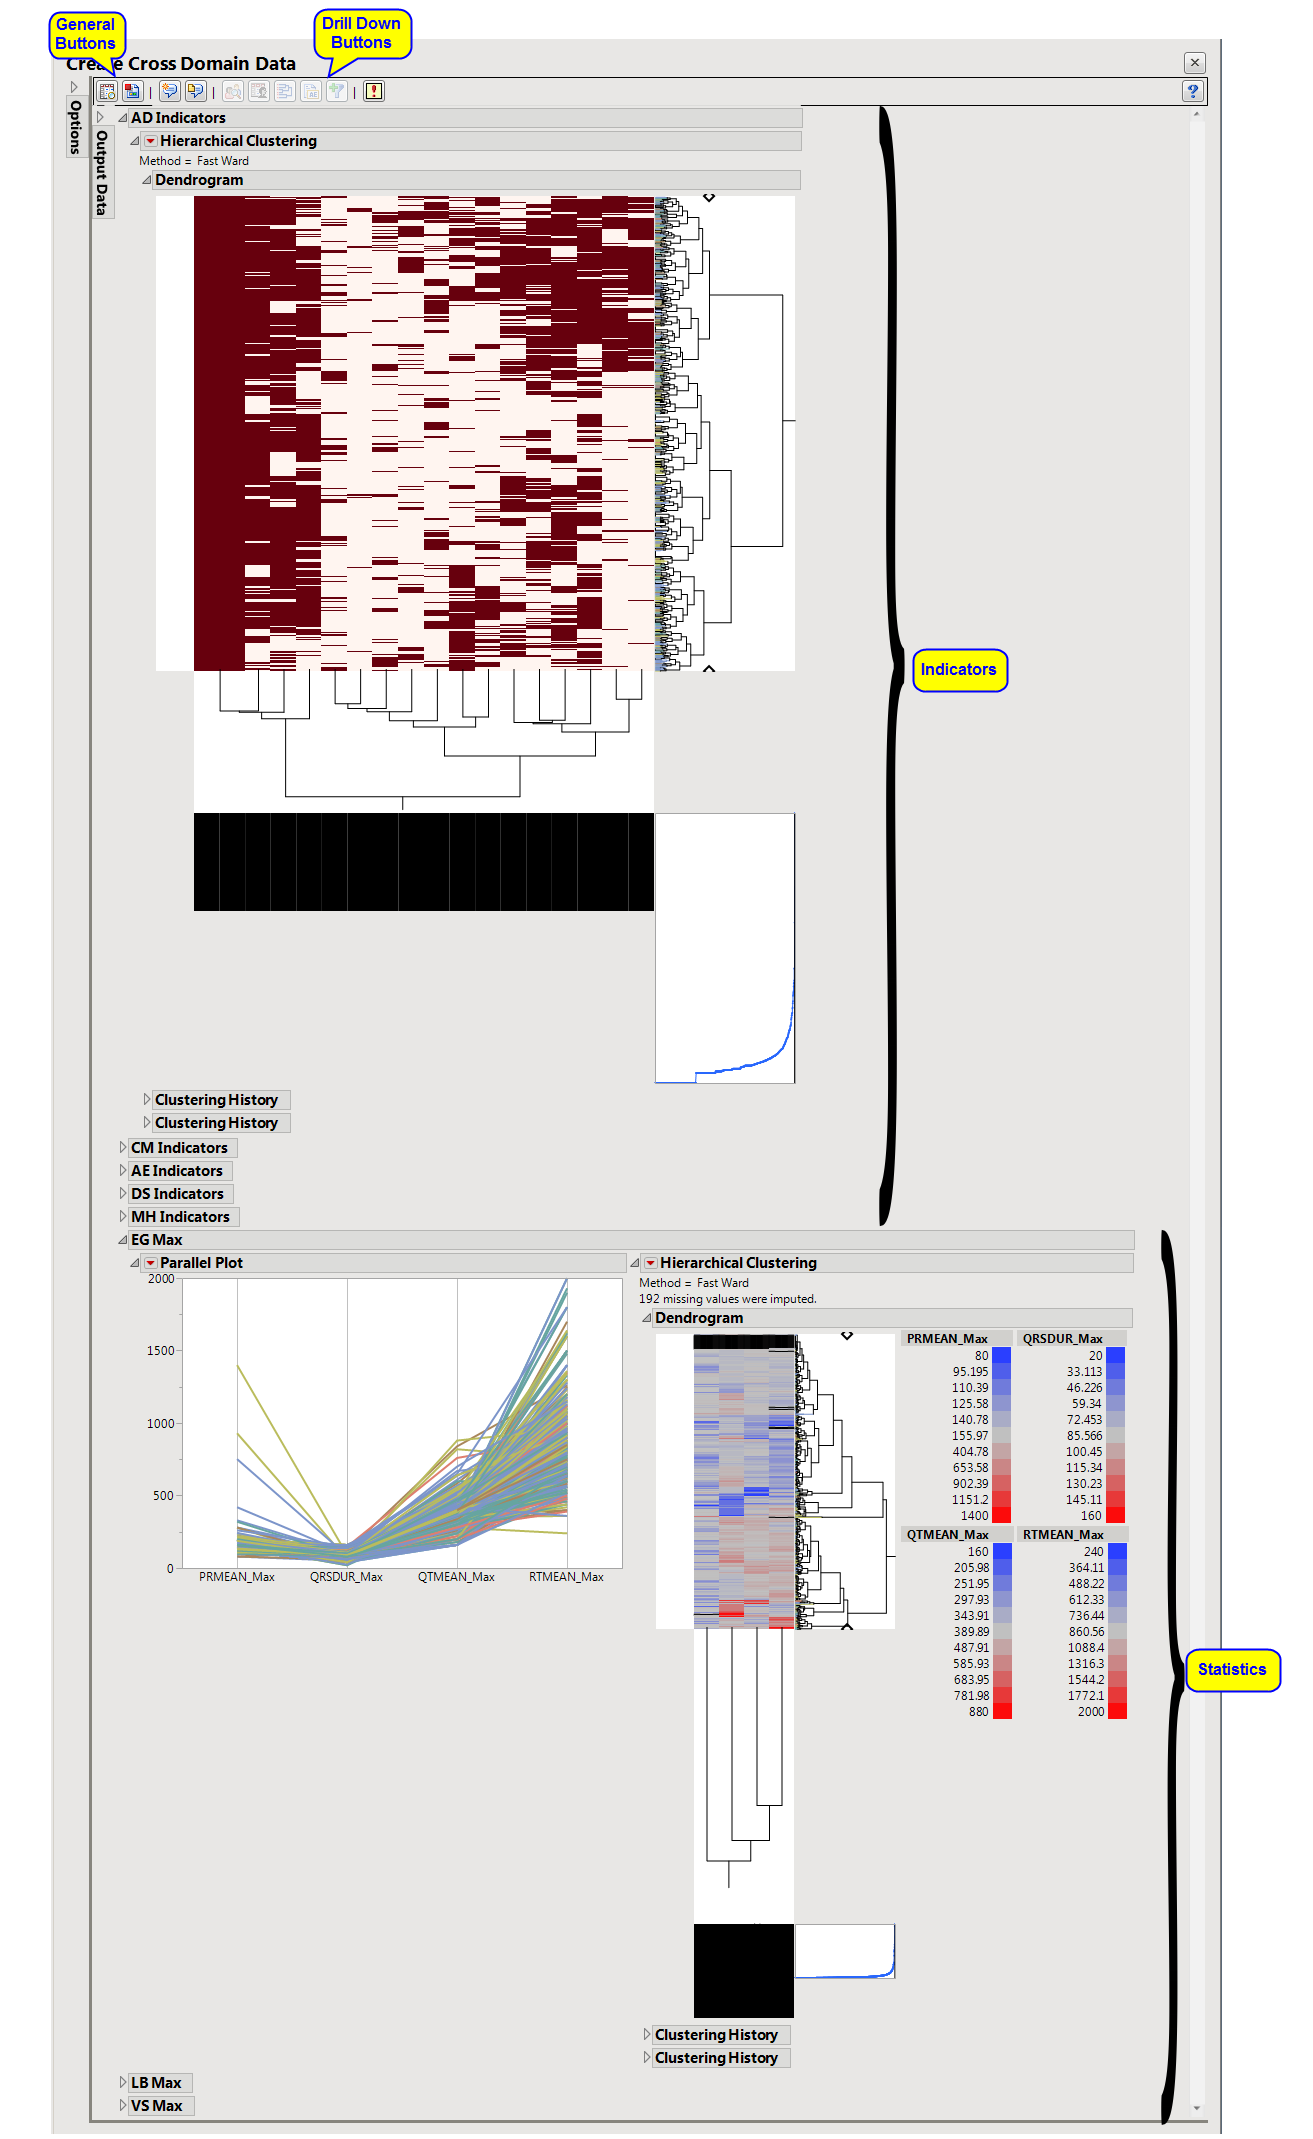
The
Results
window contains the following panes:
This pane provides you with a space to view individual sections within the
Results
window. Use the sections to access and view the output plots and associated data sets.
|
•
|
Indicators
: Hierarchically clusters all binary indicator
variables
. One tab is created for
each
domain (
ADSL
(AD), Concomitant Medications (CM),
Adverse Events
(AE), Disposition (DS), Medical History (MH), and Laboratory Test Results (LB)) that has
binary variables
, depending on the options selected.
|
|
•
|
Statistic Tabs
: Hierarchically clusters a statistic computed on continuous variables. One tab is created for
each
domain (ECG Test Results (EG), Laboratory Test Results (LB), and Vital Signs (VS)) that has continuous variables.
|
|
•
|
Transposed Subject Data
(
adsl_cddt.sas7bdat
): This data set is the transpose of the main output table. The transposed table has domain data identifiers as rows and subjects as columns.
|
|
•
|
Profile Subjects
: Select subjects and click
|
|
•
|
Show Subjects
: Select subjects and click
|
|
•
|
Cluster Subjects
: Select subjects and click
|
|
•
|
Create Subject Filter
: Select subjects and click
|
|
•
|
Click
|
|
•
|
Click
|
|
•
|
Click
|
|
•
|
Click
|
|
•
|
Click the
arrow to reopen the completed process dialog used to generate this output.
|