The
Study Visits
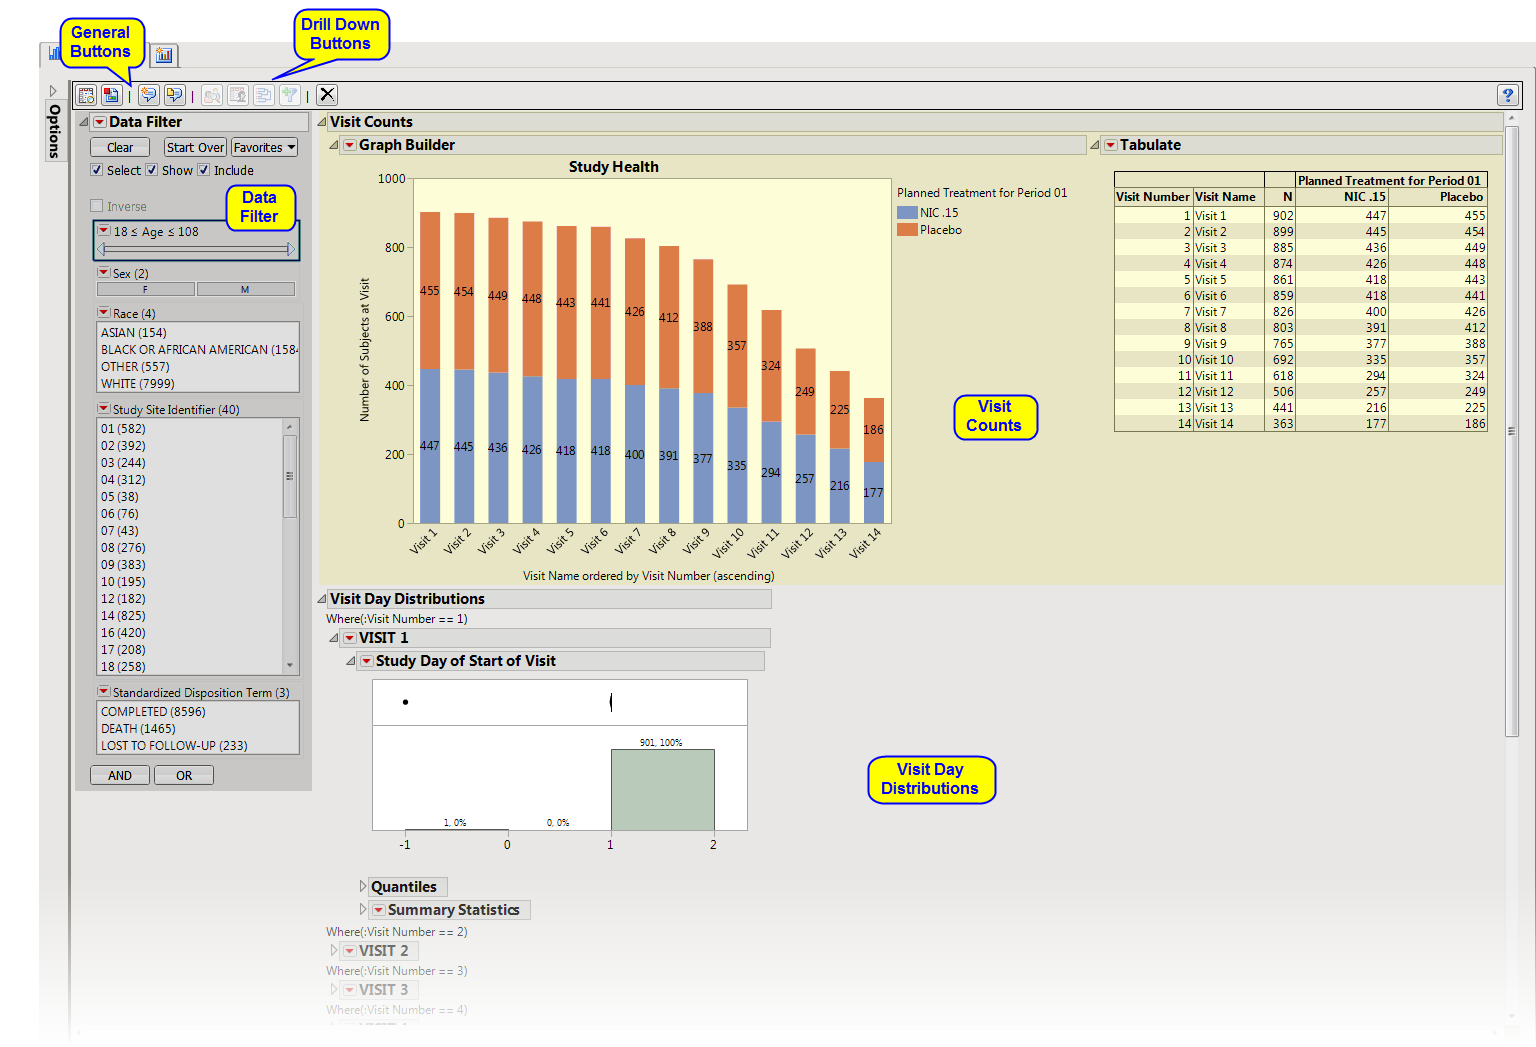
report generates a graphical display and tabulation of study visit attendance.
Running this report with the
Nicardipine
sample setting and default options generates the output shown below.
|
•
|
Visit Counts
: Presents a stacked
Bar Chart
colored by treatment and a table summarizing the number of subjects that attended each visit.
|
|
•
|
Visit Day Distributions
: Presents a
Histogram
by visit of the study days on which the visits occur. Useful to identify whether subjects have gotten off schedule or if visit dates have been entered incorrectly. There is a separate distribution for each visit.
|
This enables you to subset subjects based on demographic characteristics and
Standardized Disposition Terms
. Refer to
Data Filter
for more information.
|
•
|
Profile Subjects
: Select subjects and click
|
|
•
|
Show Subjects
: Select subjects and click
|
|
•
|
Cluster Subjects
: Select subjects and click
|
|
•
|
Create Subject Filter
: Select subjects and click
|
|
•
|
Click
|
|
•
|
Click
|
|
•
|
Click
|
|
•
|
Click
|
|
•
|
Click the
arrow to reopen the completed process dialog used to generate this output.
|