The
Weekdays and Holidays
report identifies the weekday of study dates and determines whether these dates fall on major holidays.
Running this report with the
Nicardipine
sample setting and default options generates the output shown below. Refer to the
Weekdays and Holidays
requirements description for more information.

The
Weekdays and Holidays
report initially shows a Weekdays and Holidays Volcano Plot and the
Distribution Details (Weekdays and Holidays)
.
|
•
|
Weekdays and Holidays Volcano Plot
: Compares the difference in proportions of visits on specific weekdays and holidays for each study site with the combined averages of all of the other study sites.
|
Note
: In those instances where a study is conducted at one site only, no volcano plot is generated.
|
•
|
Distribution Details (Weekdays and Holidays)
: Summarizes several
Histogram
s
describing characteristics of visit dates, demography dates, and medical history dates.
|
|
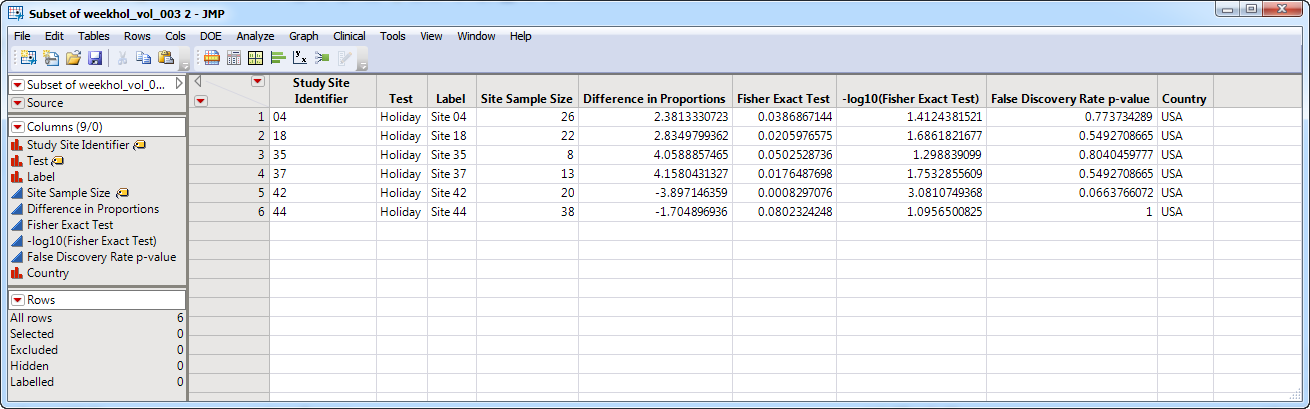
•
|
Show Sites
: Shows the rows of the data table for selected points (in this example, the points shown in the figure above) from the
volcano plot
.
|
|
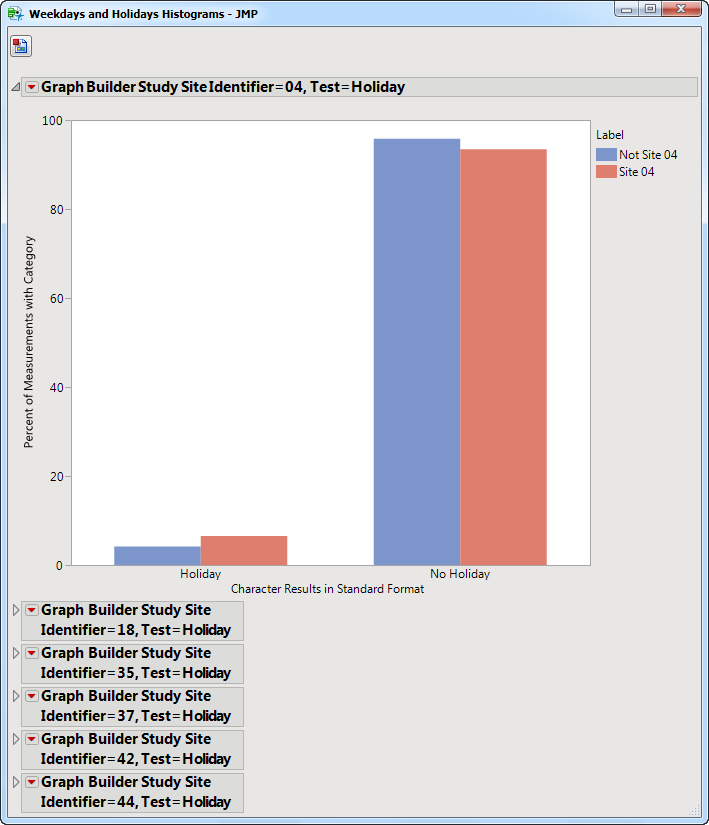
•
|
Visit Bar Charts
: For the points selected in the volcano plot, clicking
|
|
•
|
Profile Subjects
: Select subjects and click
|
|
•
|
Show Subjects
: Select subjects and click
|
|
•
|
Cluster Subjects
: Select subjects and click
|
|
•
|
Create Subject Filter
: Select subjects and click
|
|
•
|
Click
|
|
•
|
Click
|
|
•
|
Click
|
|
•
|
Click
|
|
•
|
Click the
arrow to reopen the completed process dialog used to generate this output.
|