The
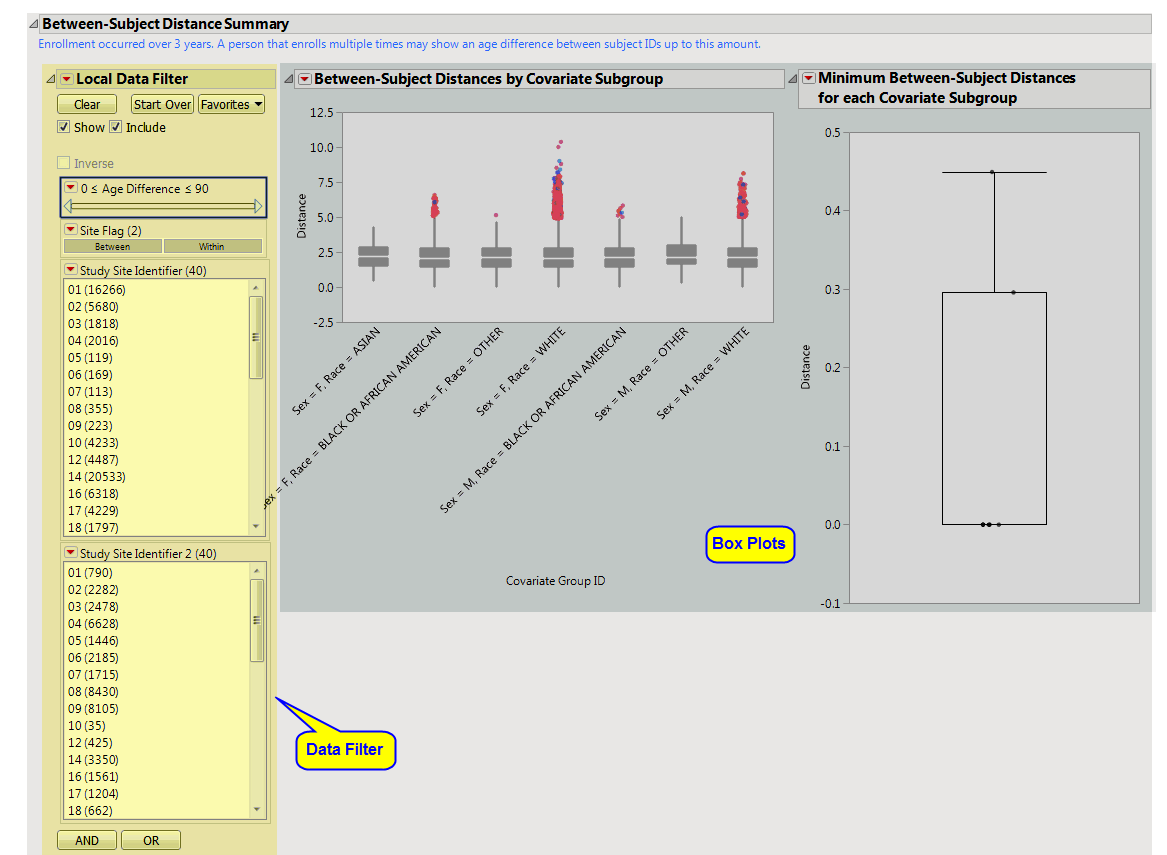
Between-Subject Distance Summary
tab is shown below.
|
•
|
Box plots
are presented for all pairwise distances between subjects in the selected
population
. Pairs are limited based on selections from the
Cluster Subjects Matching These Criteria
panel of the
dialog
. In this example, box plots are presented by gender and race. The more similar a pair of subjects, the smaller the distance value (a zero indicates a perfect match).
|
•
|
One Box Plot of
Minimum Between-Subject Distances for Each Site
.
|
The box plot of minimum distance from each
covariate
subgroup is presented in the box plot to the right. The subgroup with the most similar pair of subjects is presented on the
Subgroup Clustering
tab.
|
•
|
A
Local Data Filter
to subset histograms to data of interest. In this example data are filtered for a particular set of study monitors. Age (and height and weight, if available) are presented to limit pairs to those that are more likely to indicate a match between two subjects. Selecting
Within
subsets to pairs from subjects within the same site. Selecting
Between
subsets to subjects from different sites.
|
Refer to the
Data Filter
documentation for more information