The
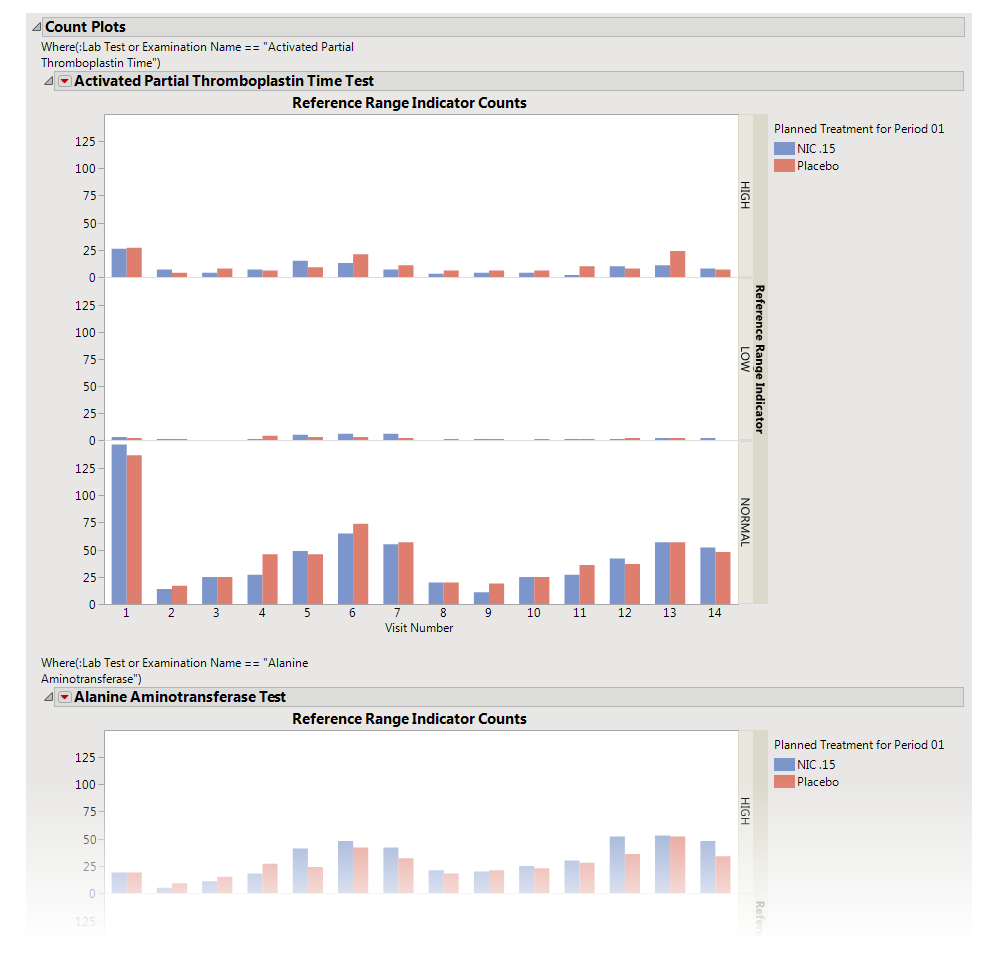
Count Plots
tab is shown below. This tab is shown only when the
xxNRIND
variable
and either
VISIT
or
VISITNUM
is found in the Findings data set.
|
•
|
These plots show the
distribution
of measurements across categories of the
Reference Range Indicator
variable (
xxNRIND
). For example, you can see how many laboratory measurements for a given test were categorized as
HIGH
,
NORMAL
, or
LOW
based on values of the
Reference Range Upper Limit
and
Reference Range Lower Limit
(
LBSTNRLO
and
LBSTNRHI
, respectively). The graph contains bars representing the counts within each category for each treatment across
Study Visits
(
VISIT
or
VISITNUM
).