The
Country-Level Data
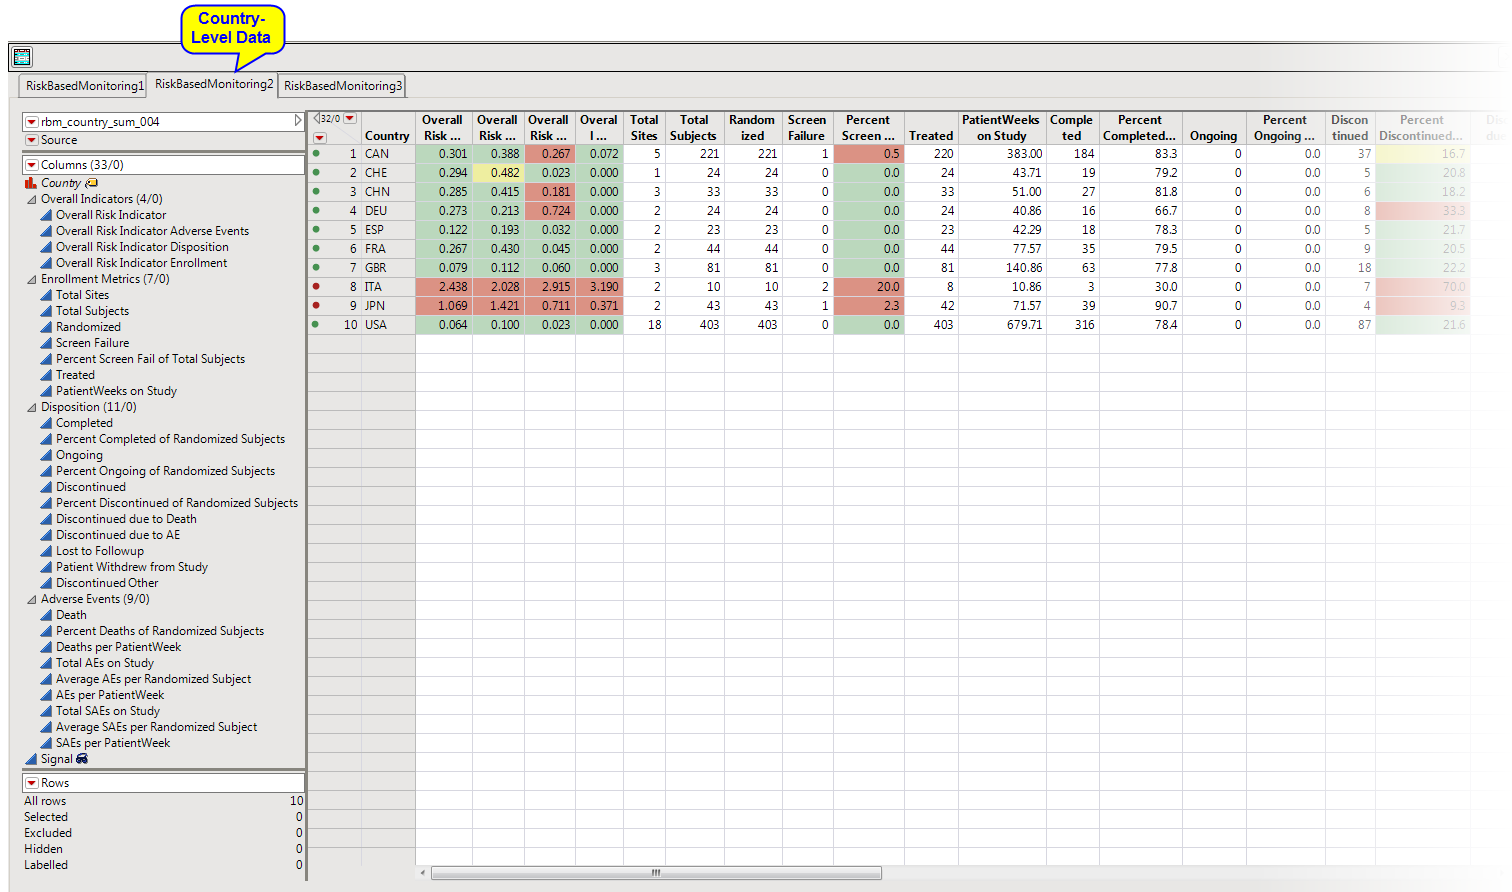
tab contains the following elements:
|
•
|
One data table
: The table has one row per country and a number of risk indicators (in columns) summarizing safety, quality metrics, and site performance at the country level.
|
From left to right, the data table shows data and risk-indicators grouped within categories: Overall Indicators, Enrollment Metrics, Disposition,
Adverse Events
, and Manually Entered Site Metrics (data from
Update Study Risk Data Set
).
Variables
contributing to category-specific Overall indicators are based on how these indicators are categorized in the data table.
The color of row markers is based on the risk indicator selected from the
Risk Indicators
drill down.
You should refer to
How are risk thresholds defined?
for information about how risk thresholds are computed.