The
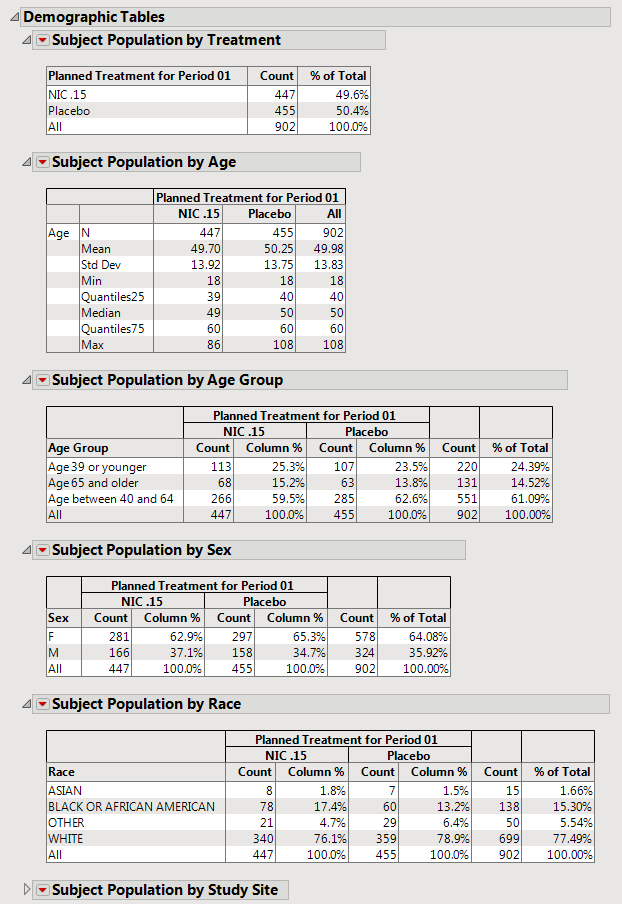
Demographic Tables
section contains the following elements:
|
•
|
Tables detailing the subject
population
by
Treatment
,
Age
,
Age Group
,
Sex
,
Race
, and
Study Site
.
|
Tip
: You can use the
Data Filter
found on the left side of the report to subset the tables on the
Demographic Tables
tab based on subject demographic characteristics and treatment.