Note
: The name of this tab reflects whatever term is selected as
Term Level
. If
Perform Double FDR Adjustment
is checked, the terms for each statistically significant group and time window (if present) that appear on the
Body System or Organ Class Results
tab are presented. If
Perform Double FDR Adjustment
is
not
checked, all
adverse events
at the
Term Level
are presented.
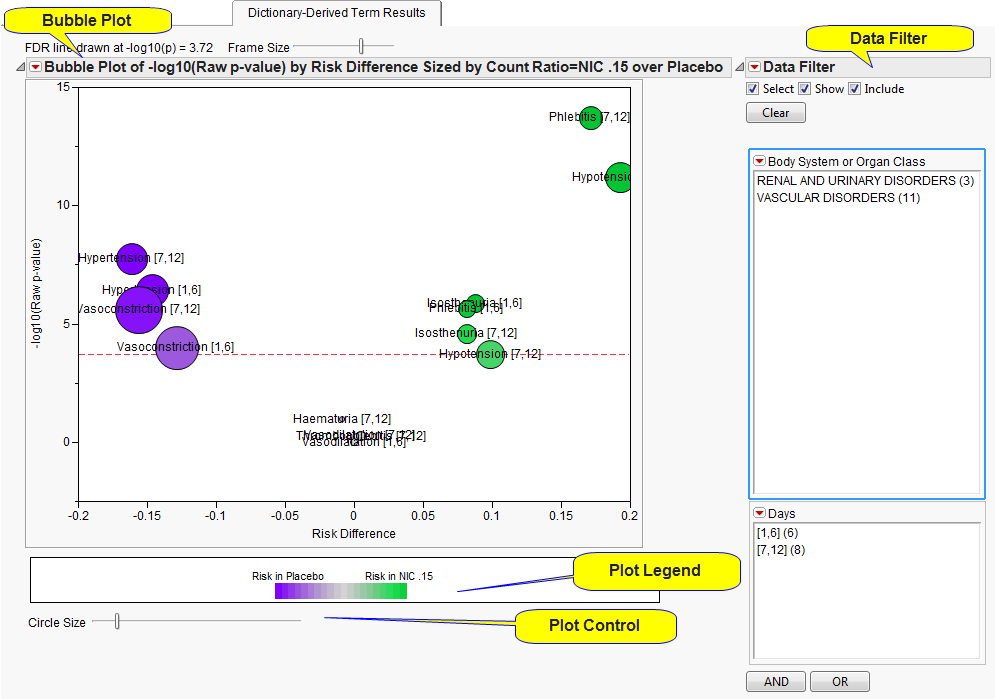
The
Dictionary-Derived Term Results
tab contains the following elements:
|
•
|
This
Volcano Plot
displays adverse events summarized at the selected
Group Level
by
Trial Time Windows
(if specified). The
x
-axis is chosen from
x-Axis for Volcano Plot
. In this example, the plot uses the difference in proportions between the treatments (
Risk Difference
). Other options include the
log
2
(Relative Risk
), which represents a doubling of the event rate for every one unit of change on the
x
-axis, or the
log
2
(Odds Ratio
), which represents a doubling of the odds of an event for every one unit of change on the
x
-axis.
In short, the smaller the
p
-value, the larger the number on the
y
-axis (
y
can be thought of as the number of decimal places or number of zeros). Adverse events that are considered statistically significant while adjusting for multiple comparisons are above the dashed red line. This line is determined based on the selected
Multiple Testing Method
. The testing method considers the adverse event
Group Level
if
Perform Double FDR Adjustment
is checked. The
p
-value is from a
Cochran-Mantel-Haenszel exact test
. If
Study ID
varies among the subjects for analysis, the test is stratified by
Study ID
.
Bubble size
is an indicator of the total number of subjects experiencing the event. Because numerous adverse events could be represented at the
Group Level
, the most statistically significant individual term defined at the
Term Level
within each
Group Level
by
Trial Time Windows
(if specified) is presented on this tab. Because
Trial Time Windows
are defined, a
Group Level
bubble is presented separately for each time window.
|
•
|
One
Data Filter
.
|