The
Distributions
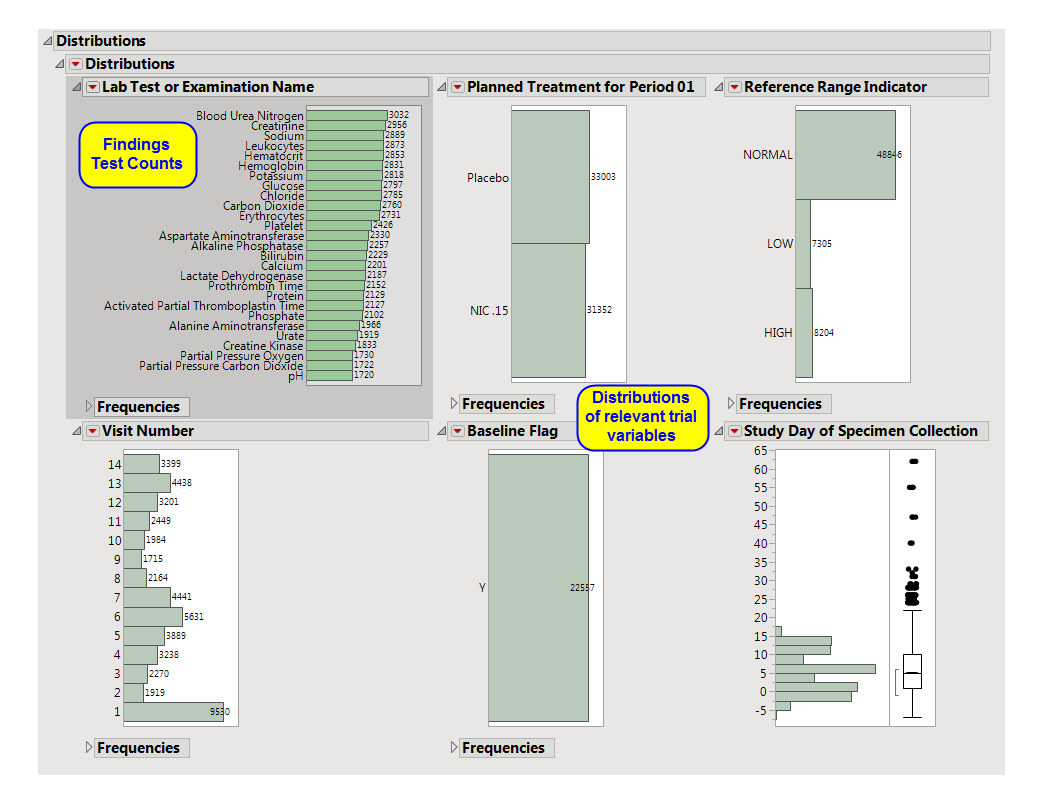
tab is shown above and contains the following elements:
|
•
|
One Findings Test
Counts Graph
.
|
This graph shows a
Histogram
displaying how often measurements were taken for each findings test (
xxTESTCD
) during the study.
|
•
|
A set of
Distributions
.
|
These display counts and histograms of relevant
variables
in the Findings data set. A
distribution
of subjects on the
Actual
,
Planned
, or
Specified Treatment
is shown as well as other findings variables (if present). Findings variables displayed can include the Findings
Body System
(
xxBODSYS
),
Reference Range Indicator
(
xxNRIND
), the
Category for the Test
(
xxCAT
) and
Subcategory
(
xxSCAT
), the
Categorical Findings Result
(
xxSTRESC
, only displayed for categorical findings domains), the
Visit
and
Time Points
at which findings were taken (
VISIT
and
xxTPT
),
Baseline Flag
(
xxBLFL
), and the
Study Day
.