The
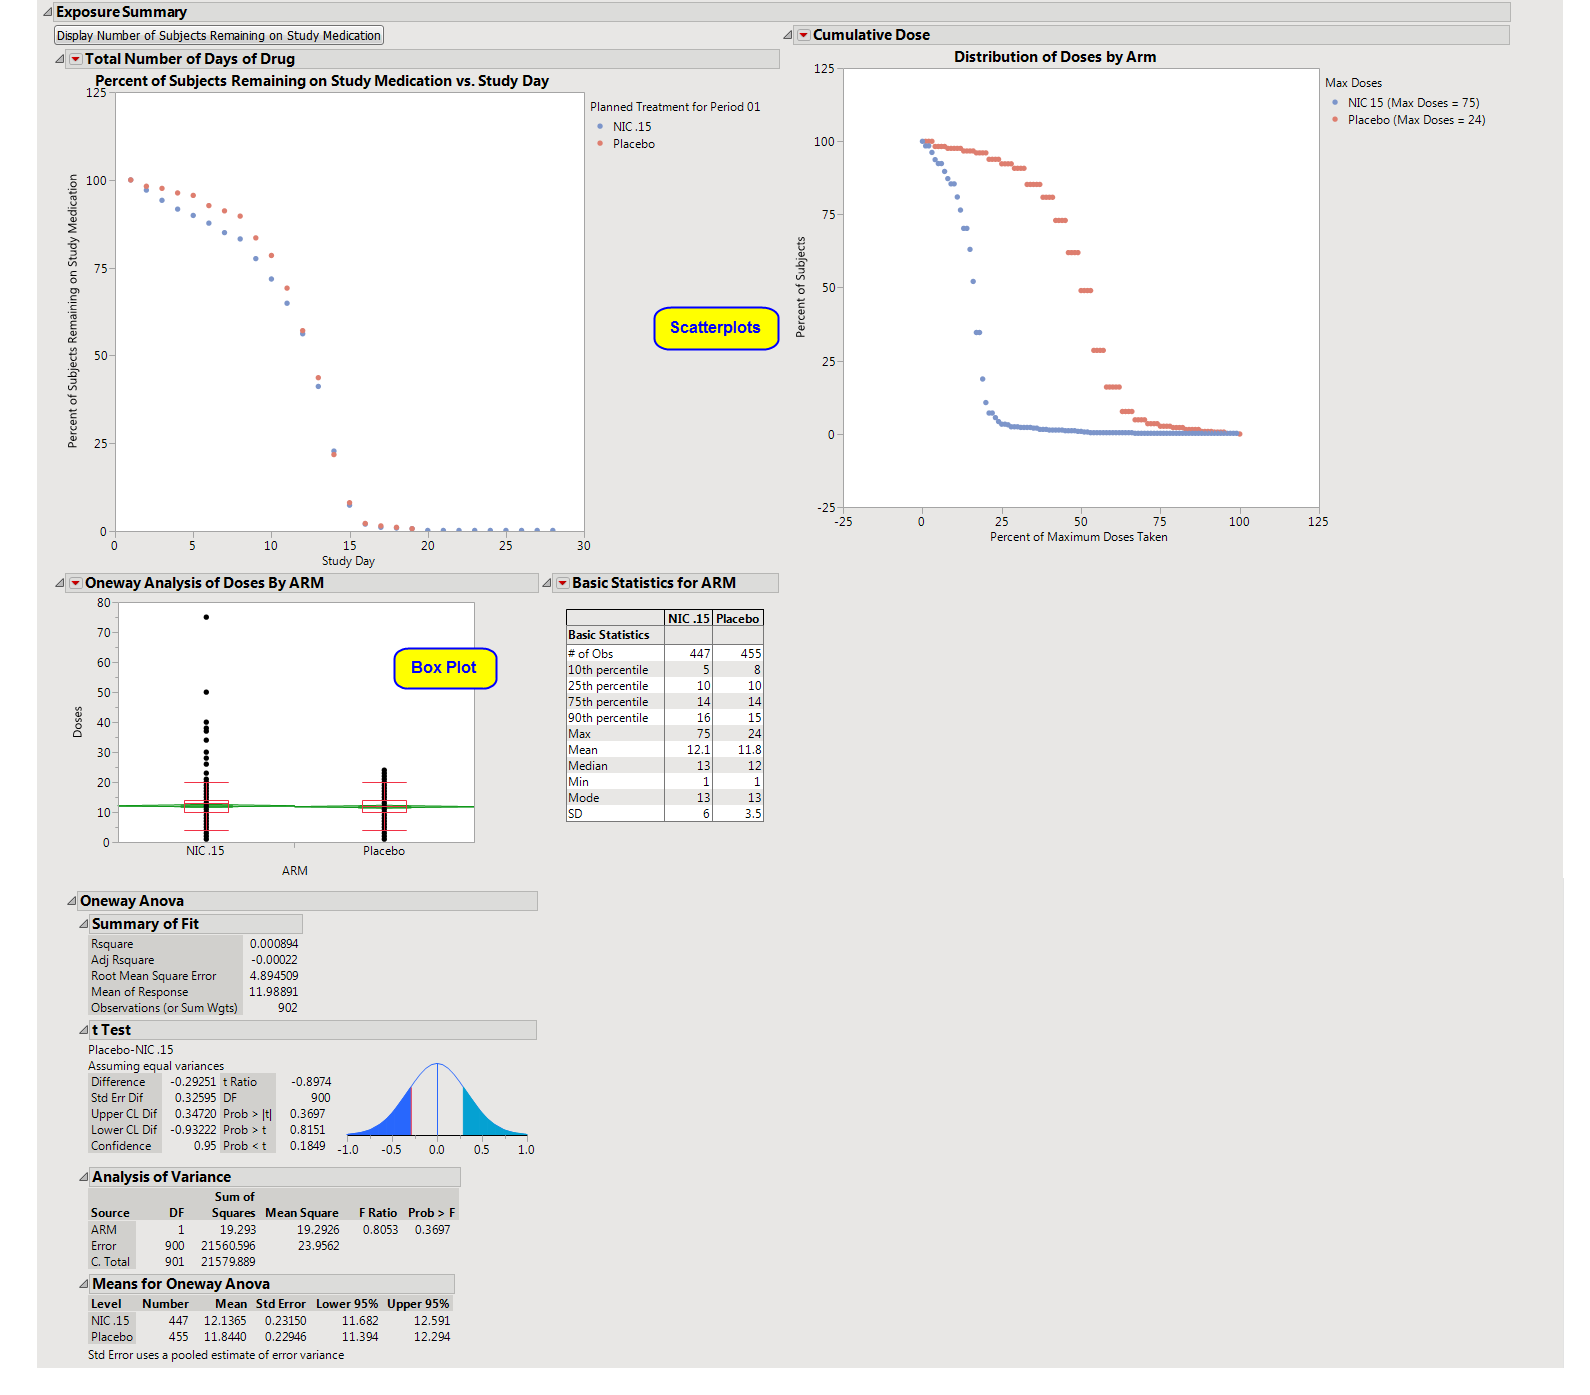
Exposure Summary
section is shown below.
|
•
|
The first shows the percentage of subjects remaining in each
arm
(plotted on the
Y
axis) on each assayed day of the study (plotted on the
X
axis). The percentages in each arm are calculated by using the number of remaining subjects assigned to that arm as the numerator and the total count of subjects who have been assigned to the arm as the denominator.
The second plot shows the
distribution
of doses among each arm's subjects in terms of a percentage of the maximum total number of doses received throughout the study in each treatment arm.
|
•
|
Box Plot
s and a table of descriptive statistics of the cumulative number of doses taken by treatment value.
|