|
•
|
One
Data Filter
.
|
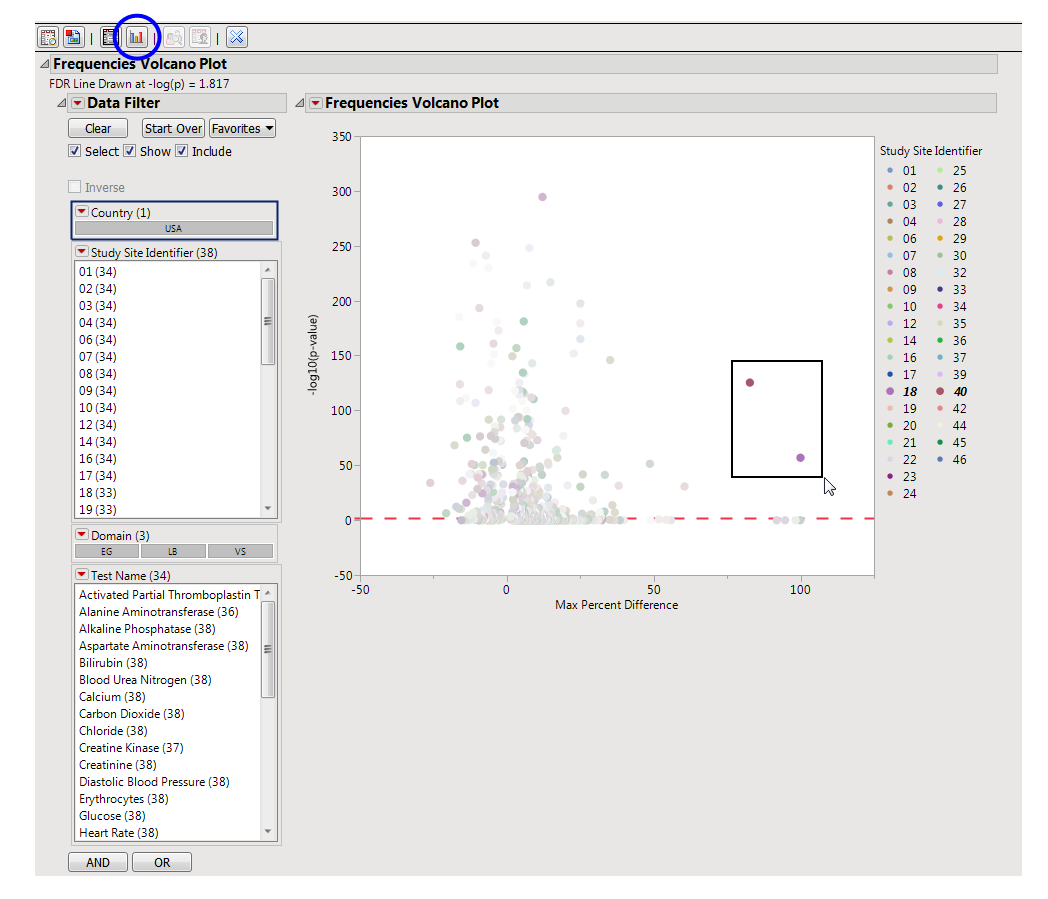
Enables you to subset subjects based on country of origin, study site and/or Test. Refer to
Data Filter
for more information.
|
•
|
The volcano plot is used to determine the deviation of the of the proportion of findings frequencies at each site with the overall proportions for the findings across the whole study. Each “bubble” represents a single Findings test for a specific site, which is compared to a reference (all other sites).The
x
-axis represents the maximum difference in proportions between each value of the Findings test between the site and the reference set (all other sites).
You can mouse over points of interest to see their labels or select points by dragging a mouse rectangle over them (as shown above). Selected rows are highlighted in other plots and you can also then click on various
Drill Down Buttons
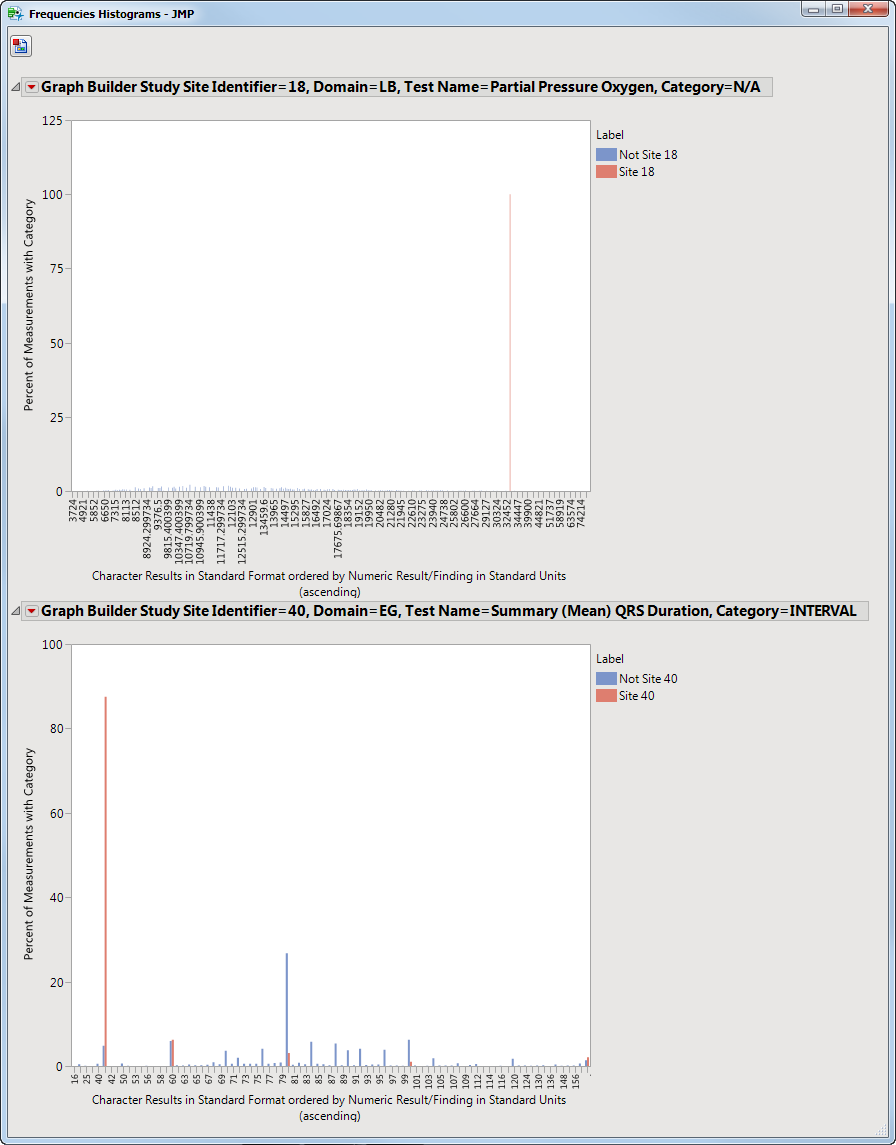
for further analyses on those specific sites. For example, if you click
 , the following window opens with comparisons of sites 18 and 40 with all sites not site 18 or 40, respectively.