
The
General
tab contains the following elements:
|
•
|
One
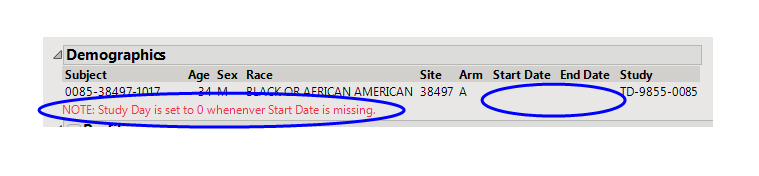
Demographics
table.
|
Note
: The study must have a defined reference start date (
RFSTDTC
). If this variable is blank, dates in the Demographics table will be empty and a warning is displayed, as shown below.
|
•
|
One
Subject Profile
.
|
This is the principal display. Time
1
is displayed along the
x
-axis and data values from available domains are grouped along the
y
-axis. When duration information is available, points are joined with a horizontal line. The color and shape of points is domain dependent and is described in the
Legend
pane in the
lower right
corner.
|
•
|
One
Medical History
pane.
|
This pane shows the medical history of the currently selected subjects, with values on the
y
-axis and time on the
x
-axis. The time scale on the
x
-axis is now in years and extends prior to the beginning of the study.
Note
: If both age (
AGE
) and birthdate (
BRTHDTC
) are unavailable, or if the start date of an event (
MHSTDTC
) is unavailable, then the age of medical history (
AGEMH
) is displayed as
0
.
|
•
|
One
Legend
.
|
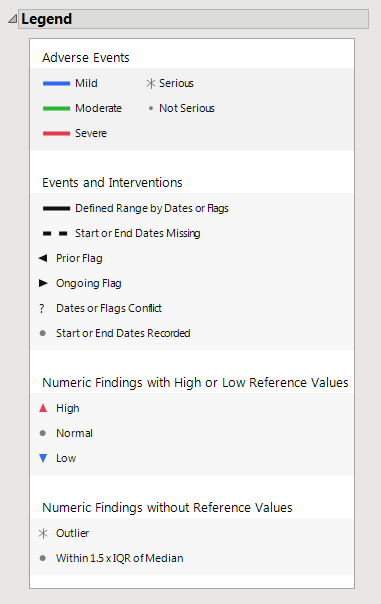
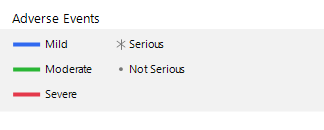
Blue, green, or red bars indicate that the events are mild, moderate, or severe, respectively, as specified by the values in the
SDTM
variable
aesev
. When you specify
aetoxgr
instead of
aesev
in your
AE
or
ADAE
domain, the color scale has five levels instead of three. The asterisk (
 ) and filled-circle (
 ) indicate whether the condition is serious or not serious, respectively, as specified by the values in the variable
aeser
.
) indicate whether the condition is serious or not serious, respectively, as specified by the values in the variable
aeser
.
Note
: Serious conditions are generally, but not necessarily, severe.
The
middle
panel (shown below) denotes line formats and symbols used for dates and times of different events and interventions.

Events or interventions with a defined range are indicated by a solid line spanning the ranges. Events or interventions with unknown start or end dates are indicated by a dashed line. Flagged events are indicated by left (prior) or right (ongoing) arrows. Conflicts are indicated by and question mark
2
. Start and End dates are denoted by a filled-circle (
).
The
bottom
panel (shown below) denotes symbols used for numeric findings.
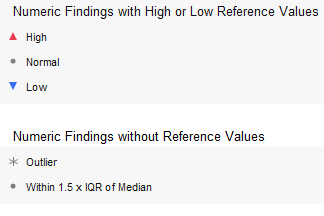
Findings that exceed the specified maximum reference value (also defined as the upper limit of normal or
ULN
) are indicated by an upward arrow (
 ). Findings that fall below the specified minimum reference value (also defined as the lower limit of normal or
LLN
) are indicated by a downward arrow (
). Findings that fall below the specified minimum reference value (also defined as the lower limit of normal or
LLN
) are indicated by a downward arrow (
 ). Findings between the
ULN
and
LLN
are indicated by a filled-circle (
). The color of the filled-circle symbol indicates where the value falls within the
distribution
observed for the study
population
, as indicated by the color scale located on the right side of the primary display (for example,
). Findings between the
ULN
and
LLN
are indicated by a filled-circle (
). The color of the filled-circle symbol indicates where the value falls within the
distribution
observed for the study
population
, as indicated by the color scale located on the right side of the primary display (for example,
 ). The ends of the color scale are the 10
th
and 90
th
percentiles
of all subjects in the study.
). The ends of the color scale are the 10
th
and 90
th
percentiles
of all subjects in the study.
Note
: The color scales are typically different for each numeric finding.
If no reference values are specified, the normal range is considered to be the
median
value over all subjects +/- 1.5 x the interquartile range (
IQR
).. Findings falling within that range are considered normal and are indicated by a filled-circle (
). Findings falling outside of that range are considered outliers and are indicated by an asterisk (
). As before, the color of the symbols indicates where the value falls within the distribution observed for the study population.
When calculating time, he start day for a record is used as the anchor point from which other elements of that row a drawn. The start day is computed from
xxSTDY
,
xxSTDC
,
xxDY
,
xxRFSTDC
, and/or
xxDTC
, depending upon the domain. When the start day is missing and the end day is not, the start day is set equal to the end day minus one. If both are missing, the start day is set equal to 0.
When processing the flag variables
xxSTRF
and
xxENRF
, the patient profiler checks for the following keywords: "NOT RECOVERED/NOT RESOLVED", "NOT RECOVERED/RESOLVED", "NOT RECOVERED", "NOT RESOLVED", "RECOVERING/RESOLVING", "RECOVERING", "RESOLVING", "CONTINUING", "ONGOING". If one of these keywords is specified and also a corresponding start or end date is specified, the profile will display a "?" to represent a data conflict.