The
Hy’s Law Screening
tab consists of the following elements:
|
•
|
One
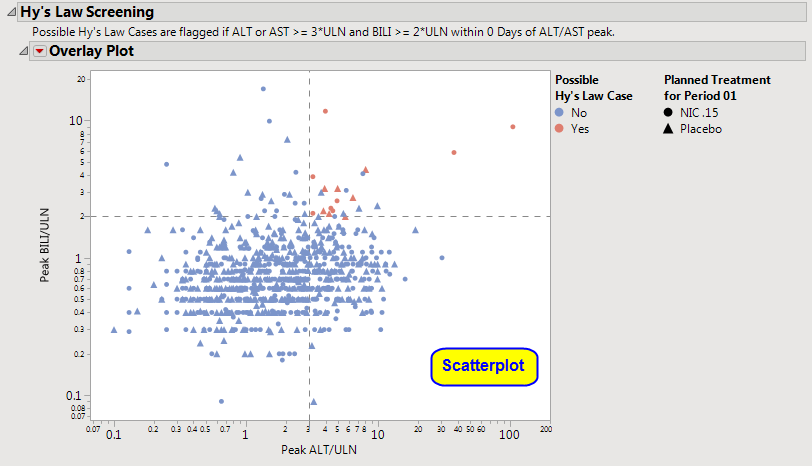
Overlay Plot
of Hy's Law Lab Tests.
|
This plot shows maximum laboratory values for the Alanine Aminotransferase (
ALT
), Aspartate Aminotransferase (
AST
), Total Bilirubin (
BILI
), and Alkaline Phosphatase (
ALP
) laboratory tests. The values are log
2
transformed (this can be changed to log
10
or
no transformation
in the process
dialog
) and normalized by the Upper Limit of Normal (
LBSTNRHI
). Reference lines are drawn by default at 3*
ULN
for
ALT
and
AST
and 2*
ULN
for
BILI
and
ALP
. These reference limits can be customized on the dialog.
These limits are also used to create the Hy's Law indicator flag. Subjects with a test value exceeding 3*
ULN
for
ALT
or
AST
(signs of hepatocellular injury) accompanied or followed by elevation of 2*
ULN
or greater for the
BILI
test will have a "Yes" value for the
Hys Law Case
variable
created. A note defining the Hy's Law flag is located
above
the
scatterplot
matrix. For example, with the default settings the note is as follows: "
Hys Law Cases are flagged if ALT or AST >= 3*ULN and BILI >= 2*ULN within 0 Days of ALT/AST peak.
" You can change the number of days following
ALT
/
AST
elevation for which to look for BILI elevation to flag possible Hy's Law cases on the process dialog. Subjects in the plot are colored by the Hy's Law criteria (
red
for "Yes",
blue
for "No") and marked by their treatment
arm
. You can choose to label the quadrants of Hy's Law (Cholestasis, Hy's Law, and Temple's Corollary) in the
bottom left
scatterplot through a check box option on the dialog.