The
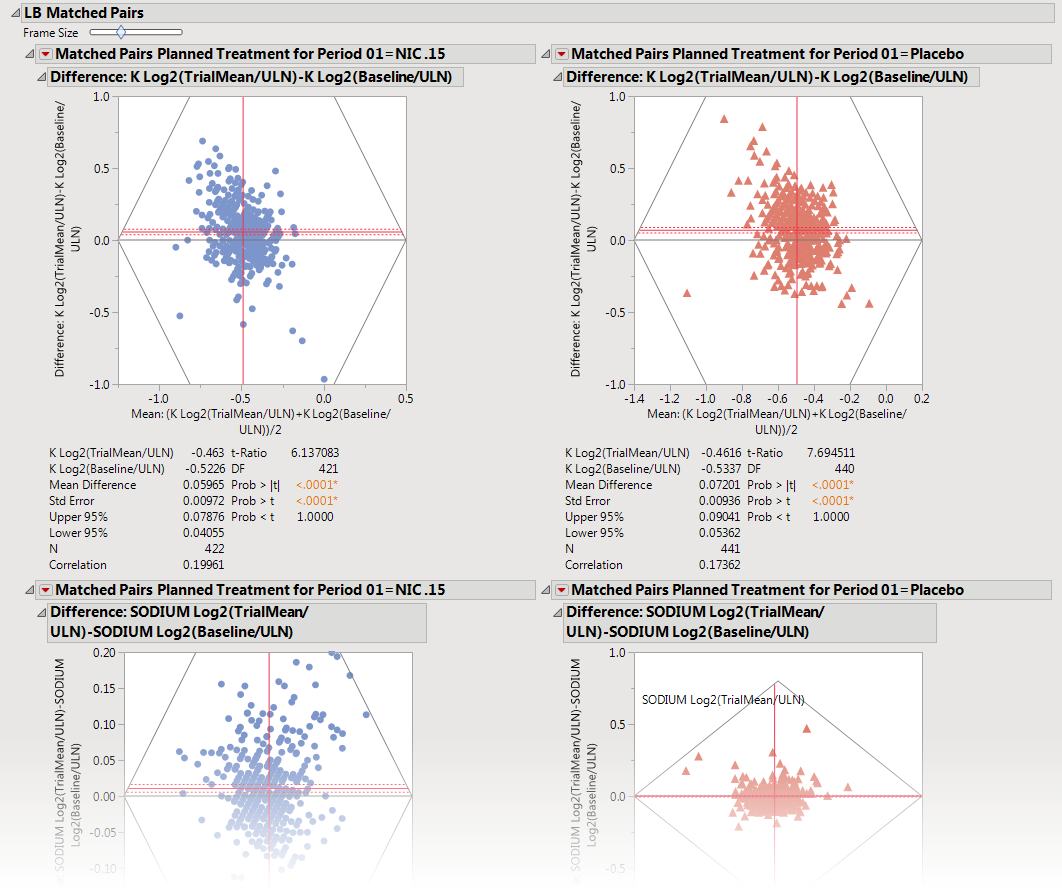
LB Matched Pairs
tab is shown below.
|
•
|
A set of
Matched Pairs Analysis
Plots.
|
Each
Matched Pairs Analysis
Plot set compares the different treatment groups for each finding.
Blue
dots (
left
) represent patients treated with nicardipine.
Red
dots (
right
) represent patients treated with the placebo. In the example shown above, nicardipine appears to have little effect on individual potassium level or variation of potassium level between patients.