The
LB Shift Plots
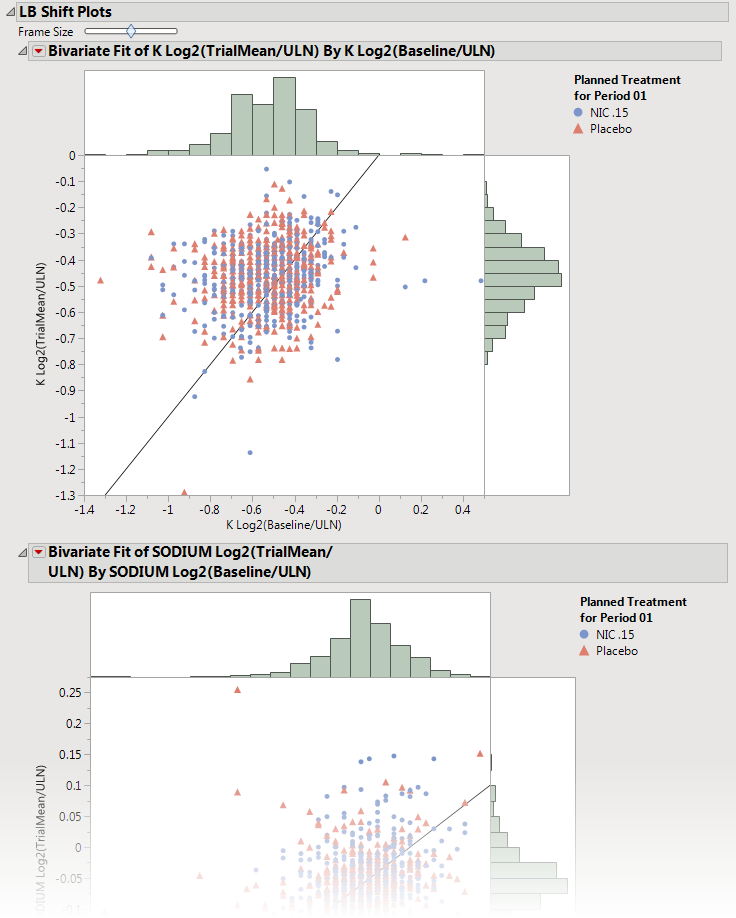
tab is shown below.
|
•
|
These plots show how findings levels change from baseline values as a result of treatment.
Blue
points represent patients treated with nicardipine.
Red
points represent patients receiving the placebo. The approximately square spread of points (with a diagonal line splitting approximately even across it) indicates similar variability of measurements before and after treatment, although the placebo group appears to have greater variability in both cases compared to the treatment group (due to outliers).