The
LB Shift Tables
section is shown below.
Note
: This section is generated only if the
Display cross-tabulation tables of Baseline versus Trial laboratory measurement elevations
box is checked on the process
dialog
.
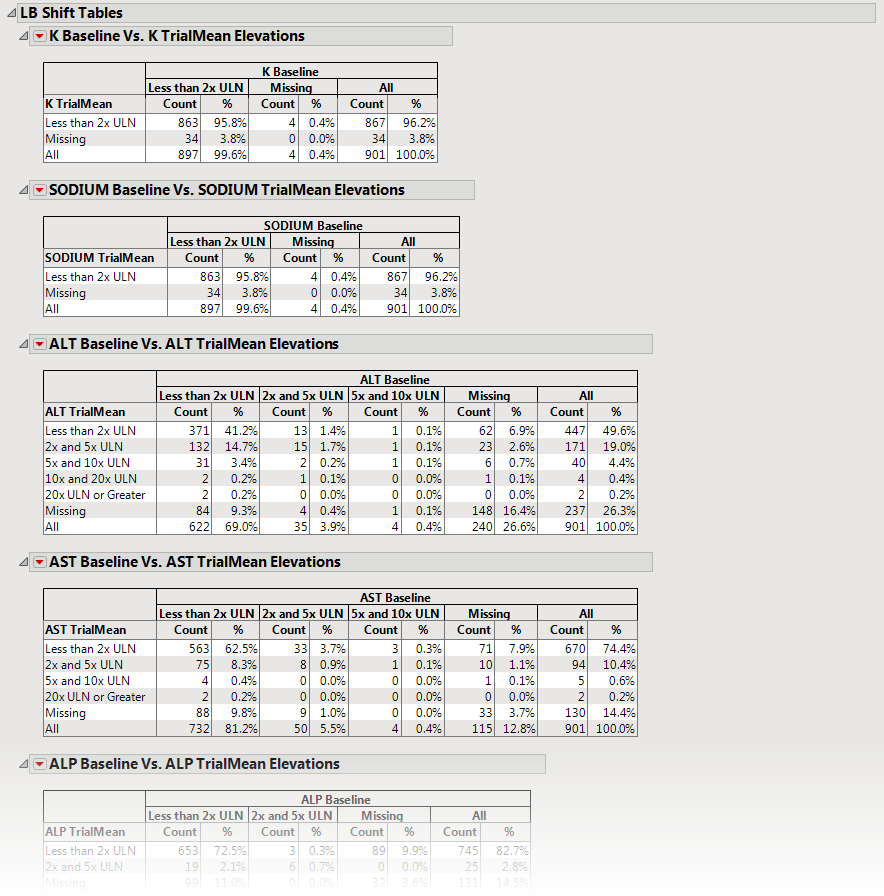
These tables contain subject counts and percentages (for each treatment group) of laboratory elevations in reference to the upper limit of normal (
LBSTNRHI
) for measurements taken at baseline versus trial summary measurements. Each table can be interpreted as a categorized representation of the shift from baseline.
Tip
: You can select table cells to view the corresponding subjects and their locations in the respective shift and matched pairs plots. (See
LB Shift Plots
and
LB Matched Pairs
for more information about the tabs containing those plots.)
All tables are associated with the
Local Data Filter
(located on the
right
side). You can use this filter to subset the tables based on
variable
filters. You can select cells of these tables (either counts or percents) to select the corresponding rows in the data table.