The
Mahalanobis Distance
output are shown below.
The
Report
contains the following elements:
|
•
|
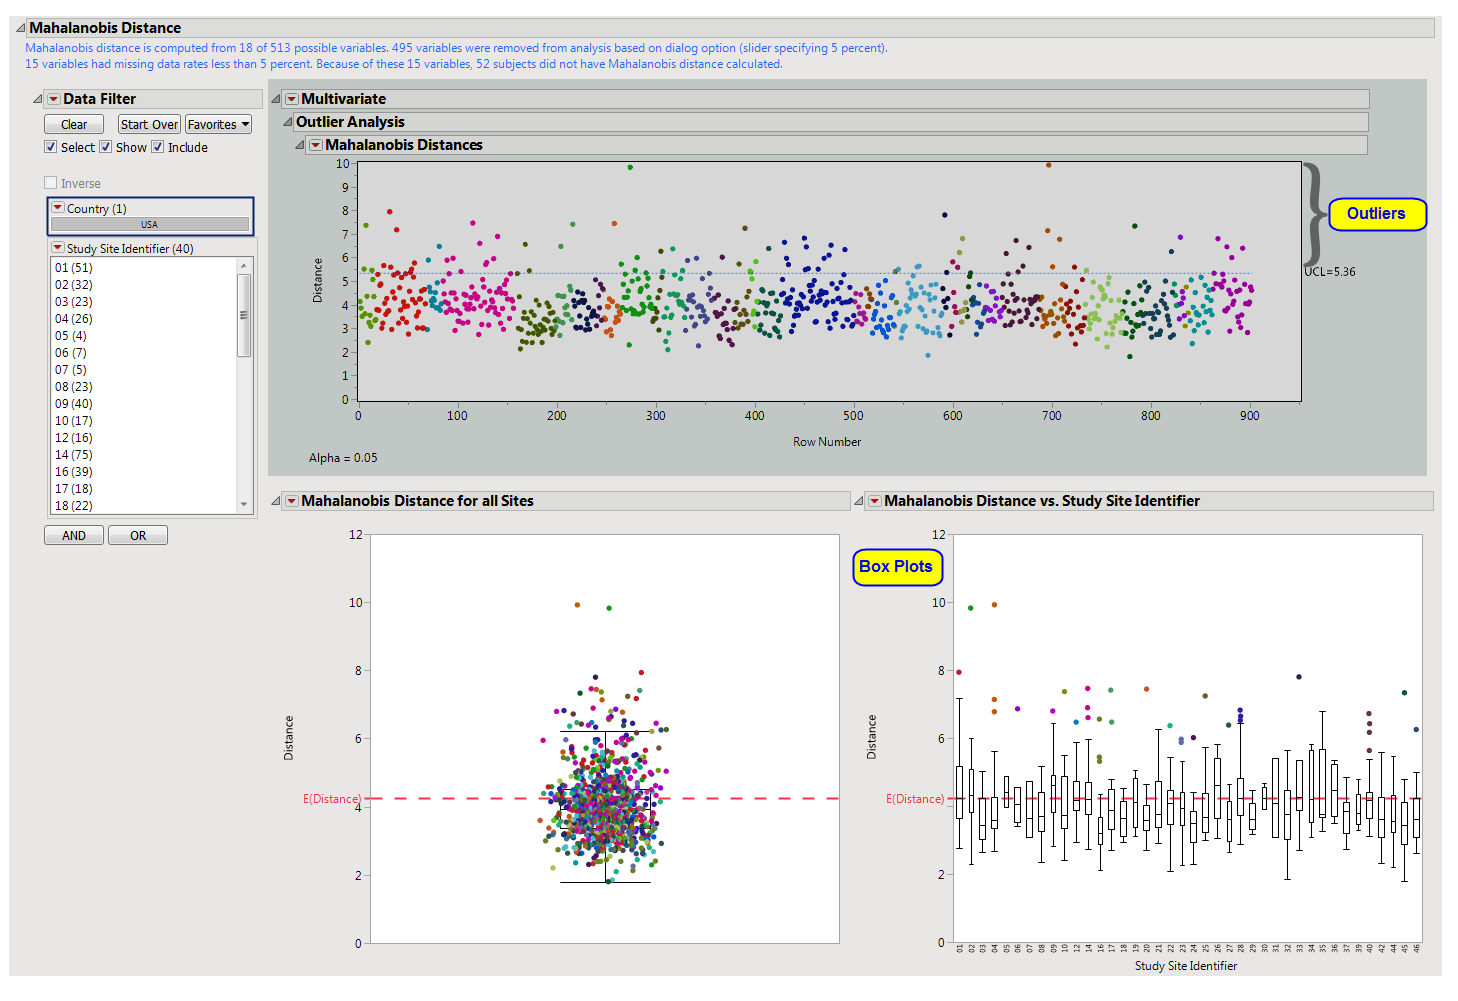
One JMP
Mahalanobis Distances
plot to identify significant outliers. In the
Mahalanobis Distances
plot shown above, the distance of each specific
observation
(row number) from the
mean
center of the other observations of each row number is plotted. Those outlier points residing above the dotted line correspond to those rows that warrant the most attention due to their significant distance from the mean center of all other observations.
|
The first
box plot
shows all subjects for which Mahalanobis Distance is calculated. Values closer to
zero
(0) reflect subjects that are close to the multivariate mean of the
variables
(inliers). Larger values represent subjects that are extreme in multivariate space. The
square
of Mahalanobis Distance is distributed as
chi-square
with
k
degrees of freedom, where
k
is the number of variables used in the calculation of Mahalanobis Distance. The redline reflects the
square root
of
k
. The second figure shows box plots by study site. This allows the analyst to determine how different sites are from the multivariate mean.
|
•
|
One
Data Filter
.
|
Enables you to subset subjects based on country of origin and study site. Refer to
Data Filter
for more information.