The
Site XX
tab is shown below:
|
•
|
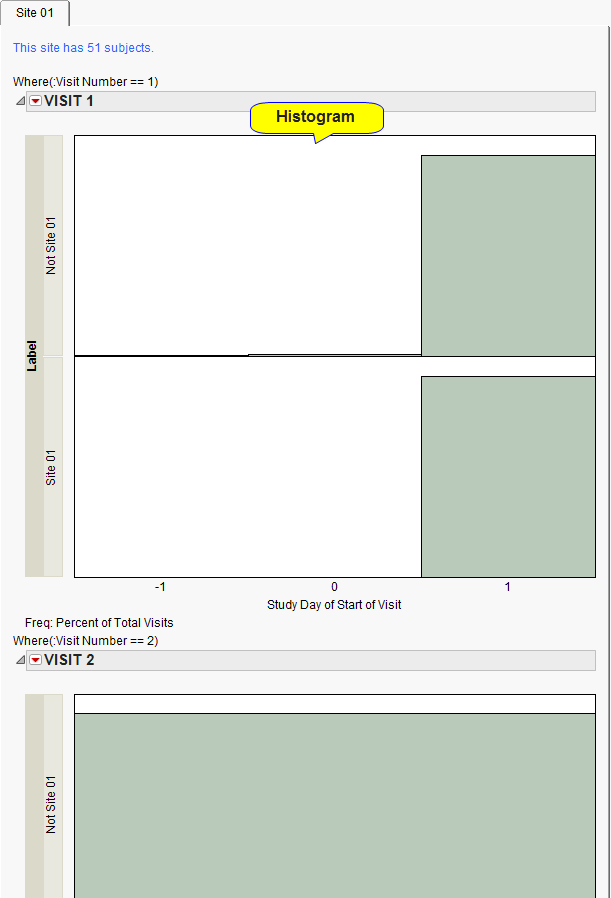
This histogram shows the proportion of visits that occur on each study day. The idea is to examine whether the
distribution
of
Site XX
varies substantially from the rest of the other sites considered together. This could identify scheduling problems, or a site where all visits occur on the expected day. The latter would be a concern only if the other sites had more of a distribution to the Visit study day. In the example above,
Site 01
has all
Visit 1
occur on
Day 1
. For all other sites, the majority of
Visit 1
occur on
Day 1
, although there are some that occur on
Day 0
and
Day 1
.