The
Site XX Distance Matrix
tab is shown below. There is one tab for each study site in the trial. However, only the site with the minimum pairwise distance is initially opened to minimize effects on performance. Other tabs can be opened using the
Tabs
menu.
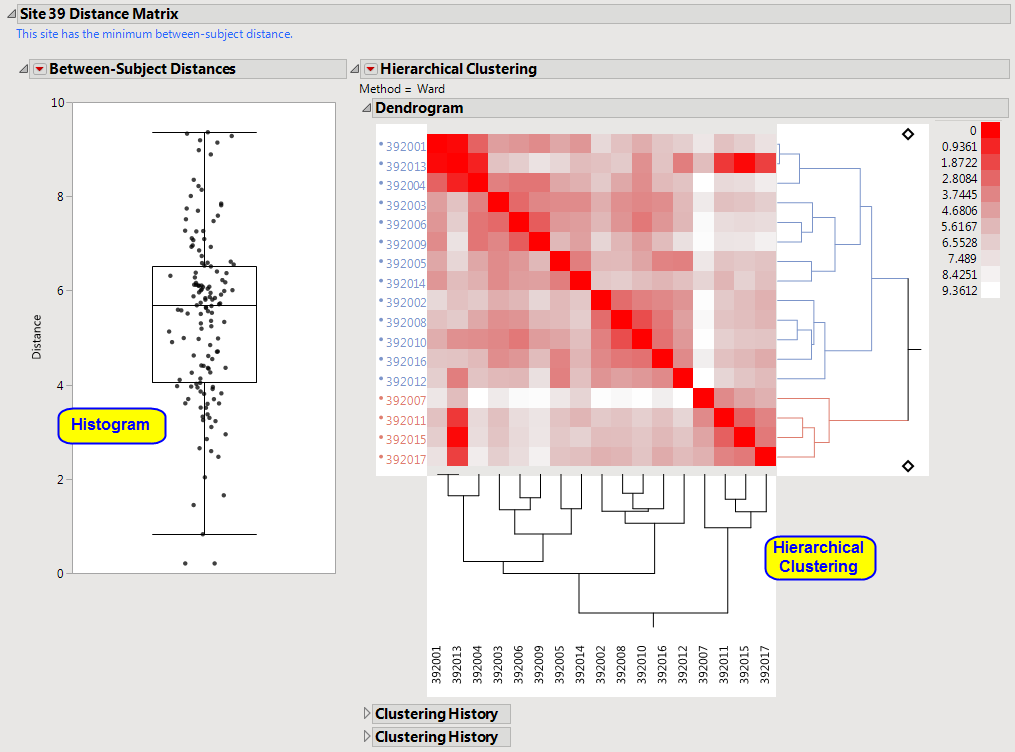
Summarizes the
distribution
of all pairwise Euclidian distances within site XX. Small pairwise distances can be selected in the
Box Plot
and highlighted in the
Hierarchical Clustering Heat Map
with the
button.
|
•
|
One
Hierarchical Clustering
display.
|
Clusters subjects based on the pairwise Euclidian distances summarized in the
box plot
. Bluer color indicates subjects that are more similar, whereas red shows subjects less similar. The
clustering
dendrogram
is presented to the right of the heat map and can shows sets of more than two subjects that are similar to one another.
See
Cluster Subjects
for more information.