|
•
|
A
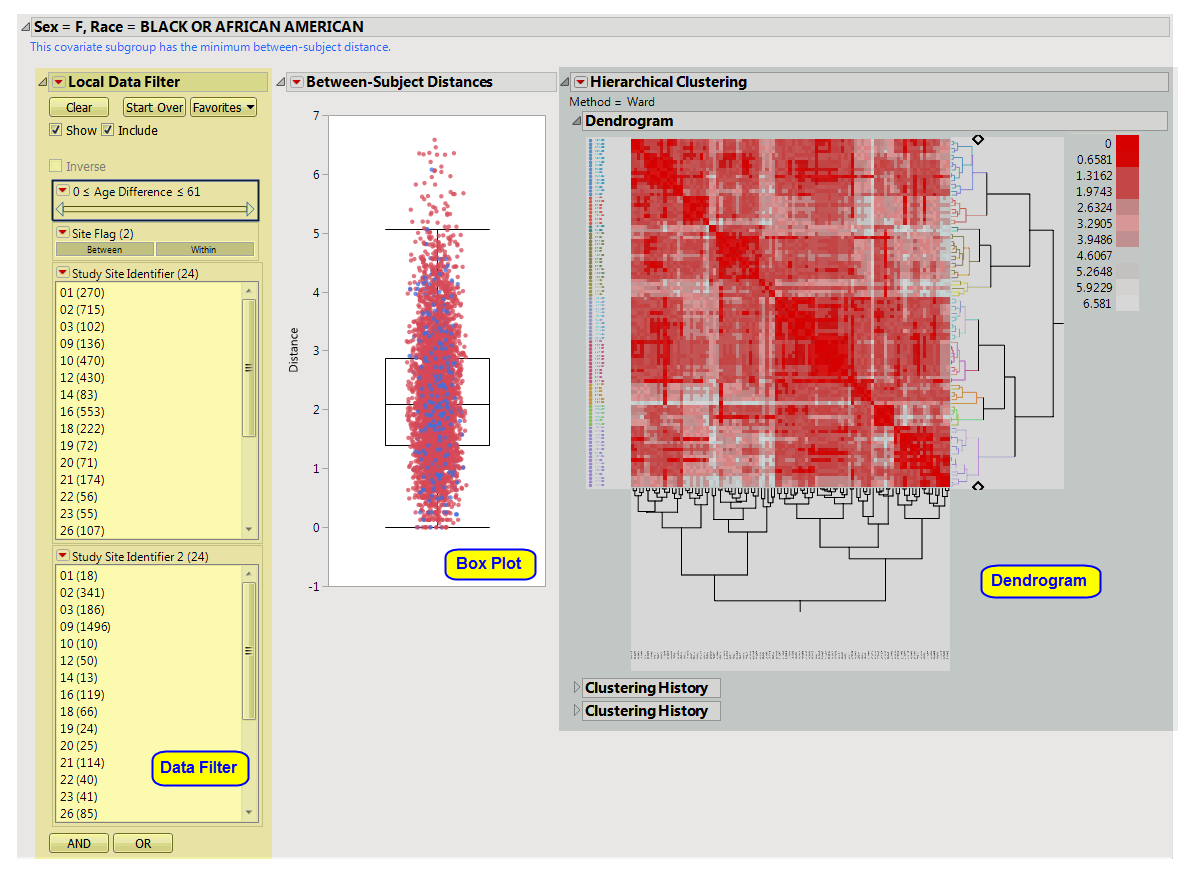
Box Plot
showing all pairwise distances between white females across all sites. Smaller distances indicate individuals that are more similar based on pre-dose information selected for use from the
dialog
. Using the data filter to subset to pairs with a small age, height and weight difference, we can highlight them in the
hierarchical clustering
profile or examine in the data table to assess similarity.
|
|
•
|
A
Dendrogram
showing the Hierarchical Clustering performed to identify subsets of subjects that might be very similar; for example, a subject that has attended at least 3 sites. Points indicating highly similar pairs of subjects can be selected from the
box plot
, and these rows can be highlighted in the clustering heat map.
|
|
•
|
A Local Data Filter to subset histograms to data of interest, for example, to data for a particular set of study monitors. Age (and height and weight, if available) are presented to limit pairs to those that are more likely to indicate a match between two subjects. Selecting
Within
subsets to pairs from subjects within the same site. Selecting
Between
subsets to subjects from different sites.
|