The
Tables
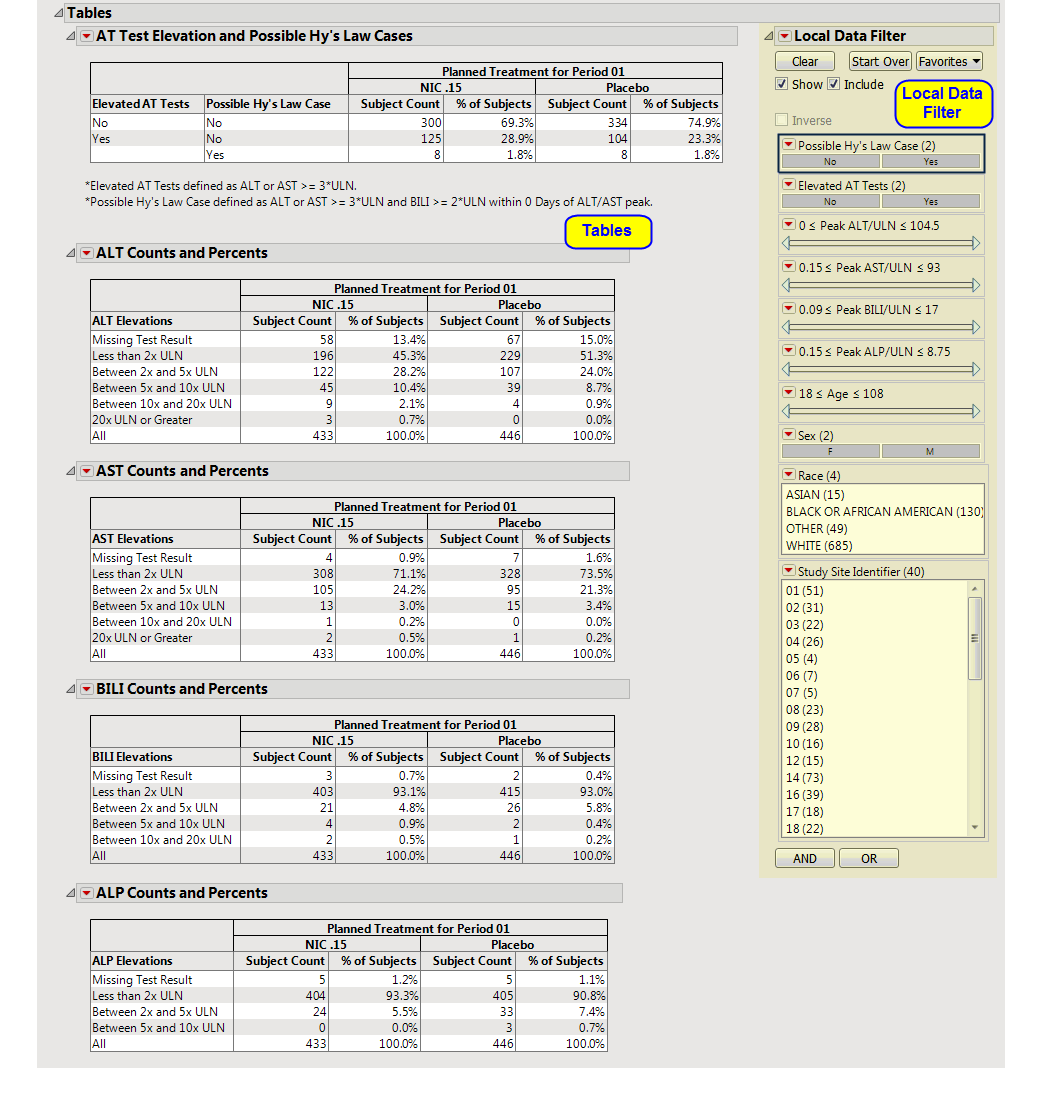
tab is shown below.
|
•
|
One
AT Test Elevation and Potential Hy’s Law Cases
table.
|
Note
: This table is shown only if at least one subject has a value of “
Yes
” for
Elevated AT Tests
.
This table lists subject count and percentages by treatment
variable
for subjects experiencing
ALT
or
AST
Elevation, or those defined as a
Hy’s Law
Case, or both.
|
•
|
A table of
Counts and Percents
for elevation categories for each liver test.
|
All tables are associated with the
Local Data Filter
(located on the
right
side). You can use this filter to subset the tables based on variable filters. You can select cells of these tables (either counts or percents) to select the corresponding rows in the data table.
Missing Test Result
is calculated as count (and percent) of subjects who had no record of a specific test (there is no row in the
lb
data set for the respective
LBTEST
for the subject) at any day of the study, have no nonmissing measurement(s) for the recorded test (
LBSTRESN
is a
missing value
), or are missing the upper limit of normal reference limit (
LBSTNRHI
is a missing value).
Important
: The counts and percentages for
Missing Test Result
on this tab are calculated out of all subjects that have at least one nonmissing result for at least one of the liver lab tests. The counts shown on the
Missing Lab Test Summary
tab include subjects that had no record or were missing all values for all four liver lab tests.
Note
: These tables are derived from the same data table that the
Hy’s Law Screening
,
Scatterplots
, and
Distributions (Hy’s Law Screening)
tabs are derived from, so any selections that you make are reflected across those tabs.
You can run drill downs off of table cell selections for an additional level of dynamic exploration.
|
•
|
One
Local Data Filter
.
|