The
Tests by Study Day
tab is shown below.
|
•
|
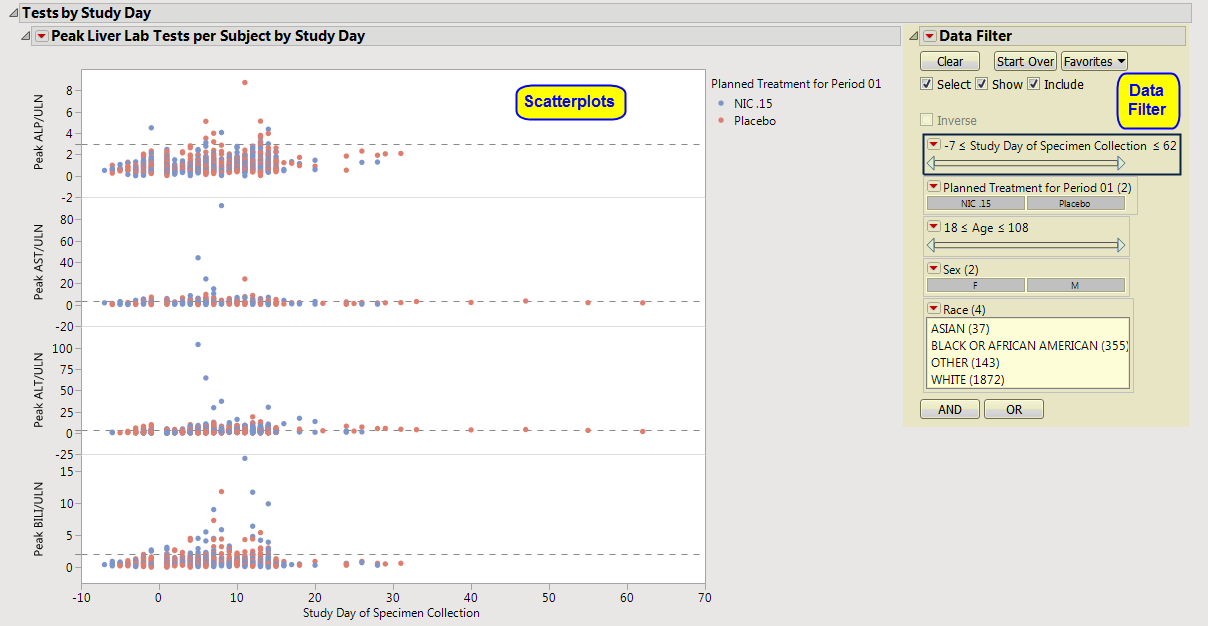
For each of the four liver tests, peak values are shown on the
y
-axis for each subject, for each
Study Day
(
LBDY
on the
x
-axis).
Points
are colored by treatment group.
Reference lines
are drawn according to typical reference limits (or those custom reference lines specified on the process
dialog
).
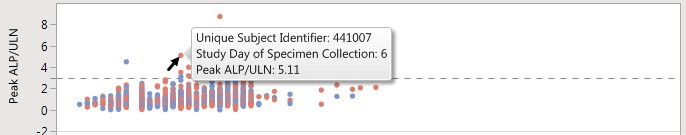
You can select points in the graph and their corresponding rows in the data table become selected. Click
to see the data table reflecting any selections that you have made.
|
•
|
One
Data Filter
.
|
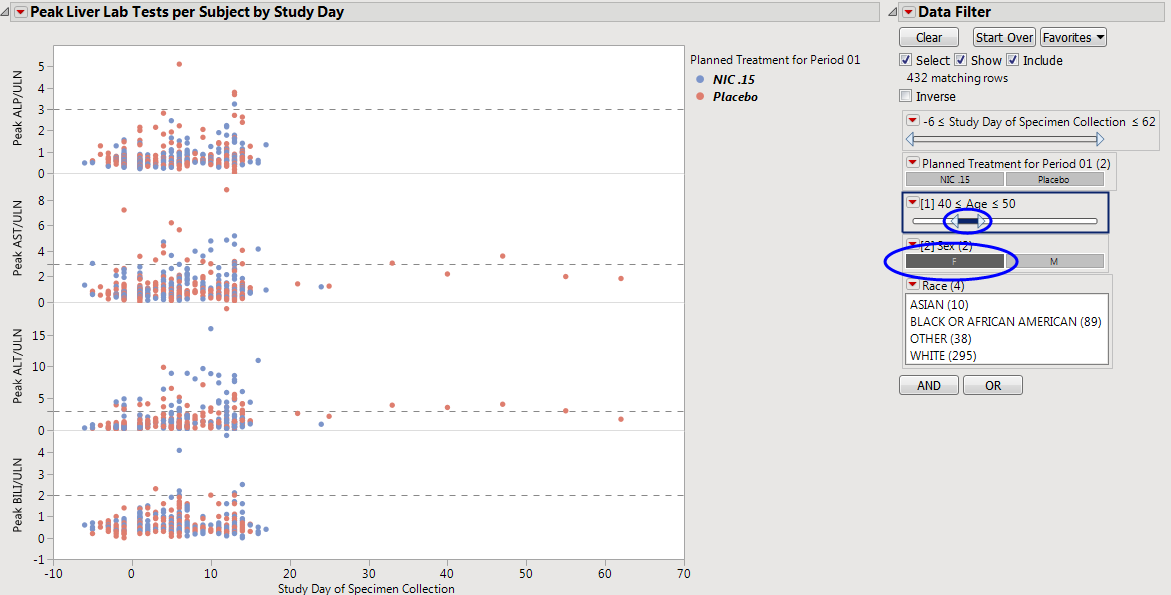
Use the data filter to subset the
scatterplot
matrix and associated data table by any of the available criteria. For example, you could filter the data by females between 40 and 50 years old. Drag the
Age
slider ends, or type over minimum and maximum age values to obtain an exact age range. The number of matching rows, selected graph points, and data table selections are updated accordingly.
Note
: This tab uses a different data set than the
Hy’s Law Screening
,
Scatterplots
, and
Distributions
tabs, so selections that you make on this tab are not linked to the others. The
Data Filter
on this tab is also independent of any other
Data Filter
found elsewhere.