Presents comparisons between the selected
Trial Time Windows
are performed for age using
one-way ANOVA
, or
Contingency Table
s
for sex, race, and ethnicity. If the study uses the SEND model, other
variables
that can be summarized include
Species
,
Strain
,
Substrain
,
Age Range
, or
Pool ID
. See JMP Documentation on Distribution for more information.
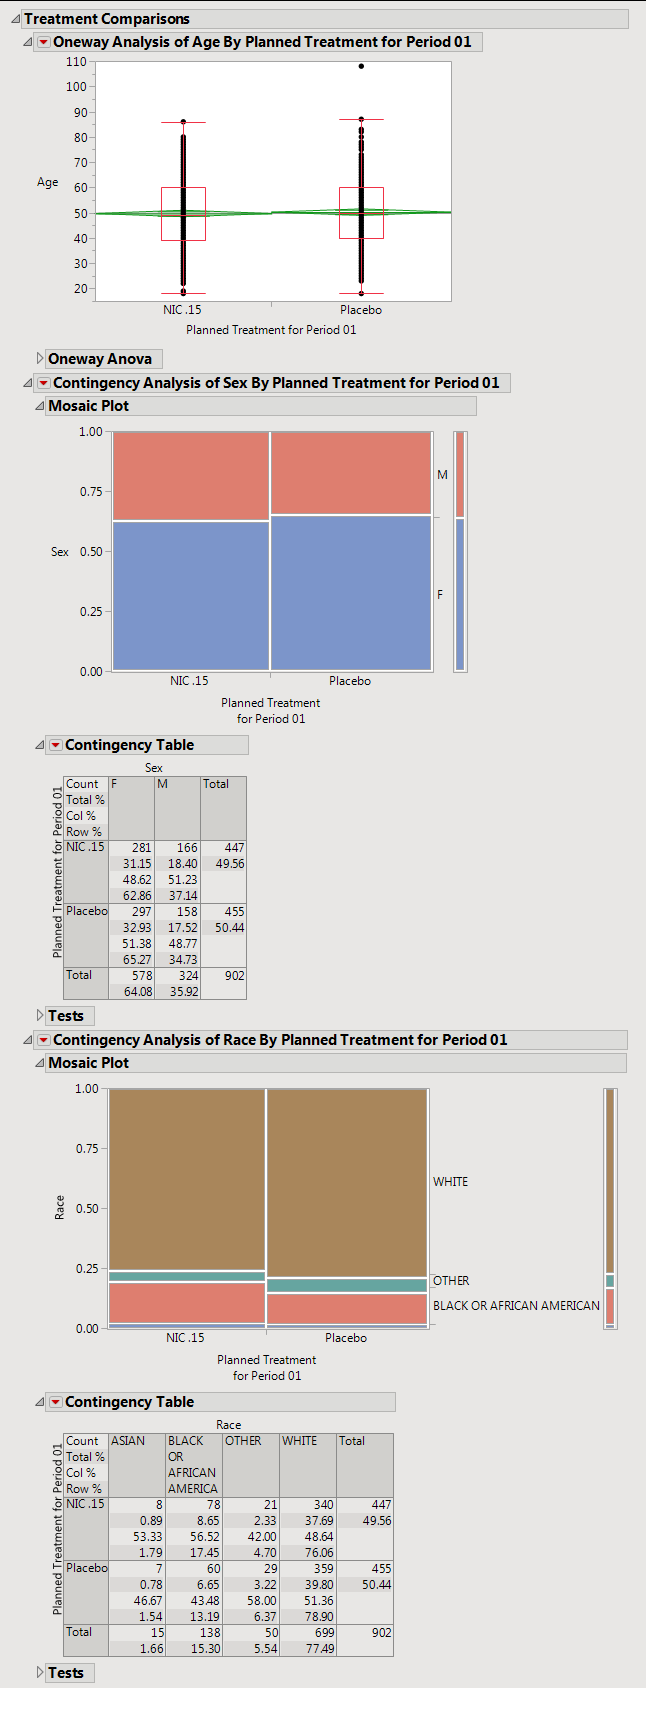
The
Treatment Comparisons
section contains the following elements:
|
•
|
One
Oneway Analysis
.
|
This performs a comparison of age between groups defined by
Trial Time Windows
. A
Box Plot
shows the
distribution
of
Age
for each treatment, as well as outliers, mean
diamonds
(which display the average for each group and the upper and lower points of the corresponding 95% confidence intervals) and the grand or overall
mean
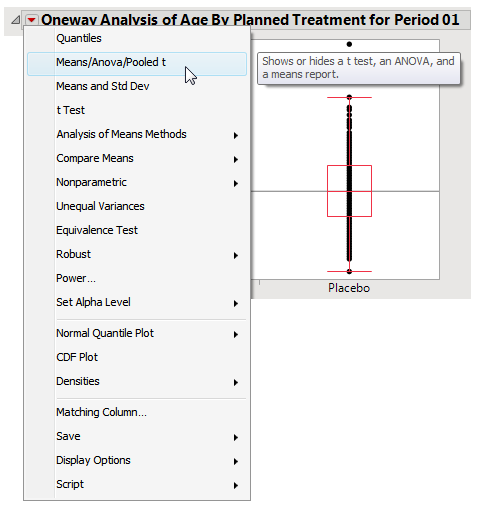
for all groups. Statistical testing is displayed as
Means/ANOVA/Pooled t
or
Means/Anova
for groups with more than 2 categories. The particular test can be changed using options under the
red triangle
(
 ).
).
|
•
|
A
contingency table
and associated plot presents a cross tabulation of the
Trial Time Windows
with
Sex
,
Race
, or
Ethnicity
, summarizes counts and percents for each level, and performs a test to see whether these distributions differ between groups defined by
Treatment Variable to Use
.
See
Contingency platform
for more information.
Tip
: You can use the
Data Filter
found on the
Distribution Details
tab to subset the plots on the
Treatment Comparisons
tab based on subject demographic characteristics and treatment.