Note
: This tab is available
only
if
BCPNN
is selected from the
Statistical Measures
input
dialog
tab.
The
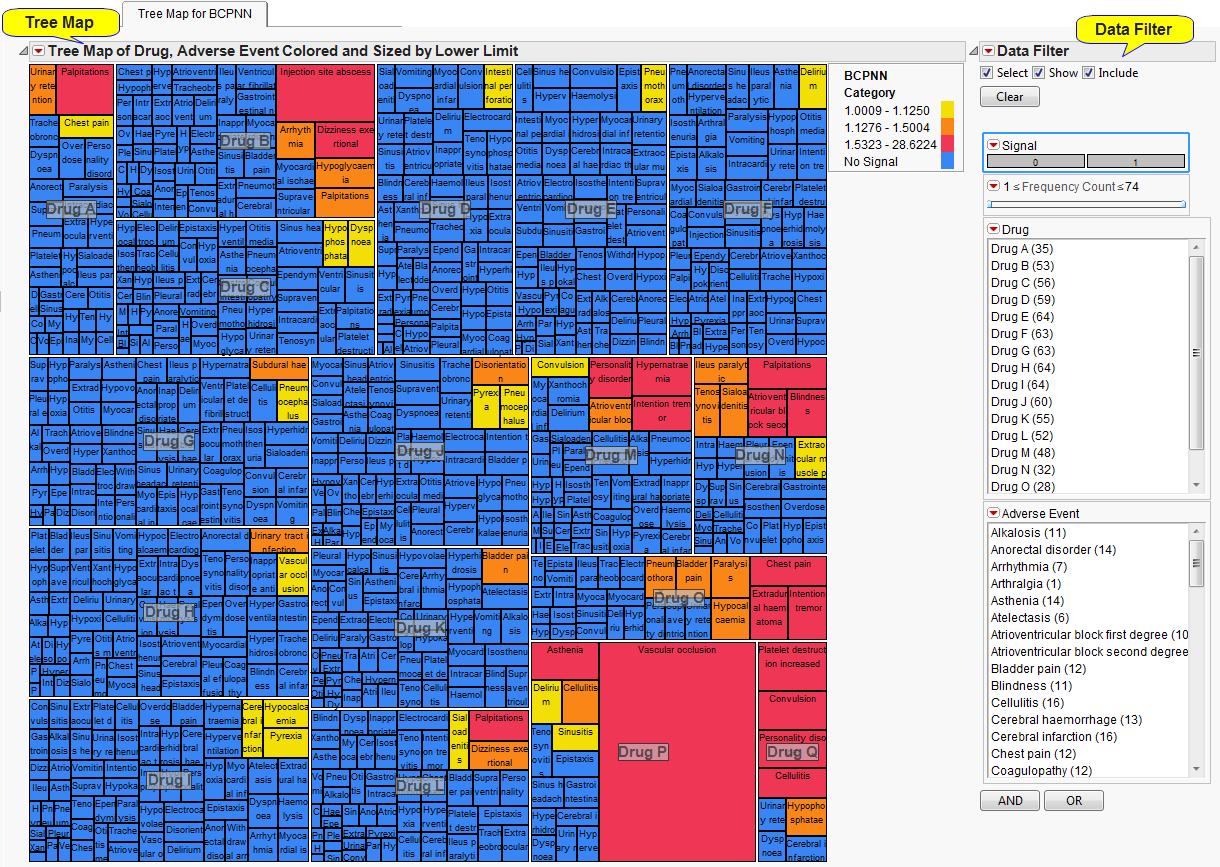
Tree Map for BCPNN
tab contains the following elements:
|
•
|
One
Tree Map
.
|
Adverse Event
cells are grouped by drug and colored and sized according to the magnitude of the lower limit of the confidence or credible interval (or estimate, based on dialog option). The larger the cell and more extreme the color, the more disproportional a drug-event combination.
clustering
and plotting drill downs use BCPNN lower limits (or estimates, based on dialog option) for cells selected from the
Tree Map
or Data Filter. Comments are created or viewed based on selected drug-event pairs, regardless of the particular
tree map
statistic.
|
•
|
One
Data Filter
.
|