The
TreeMap Results
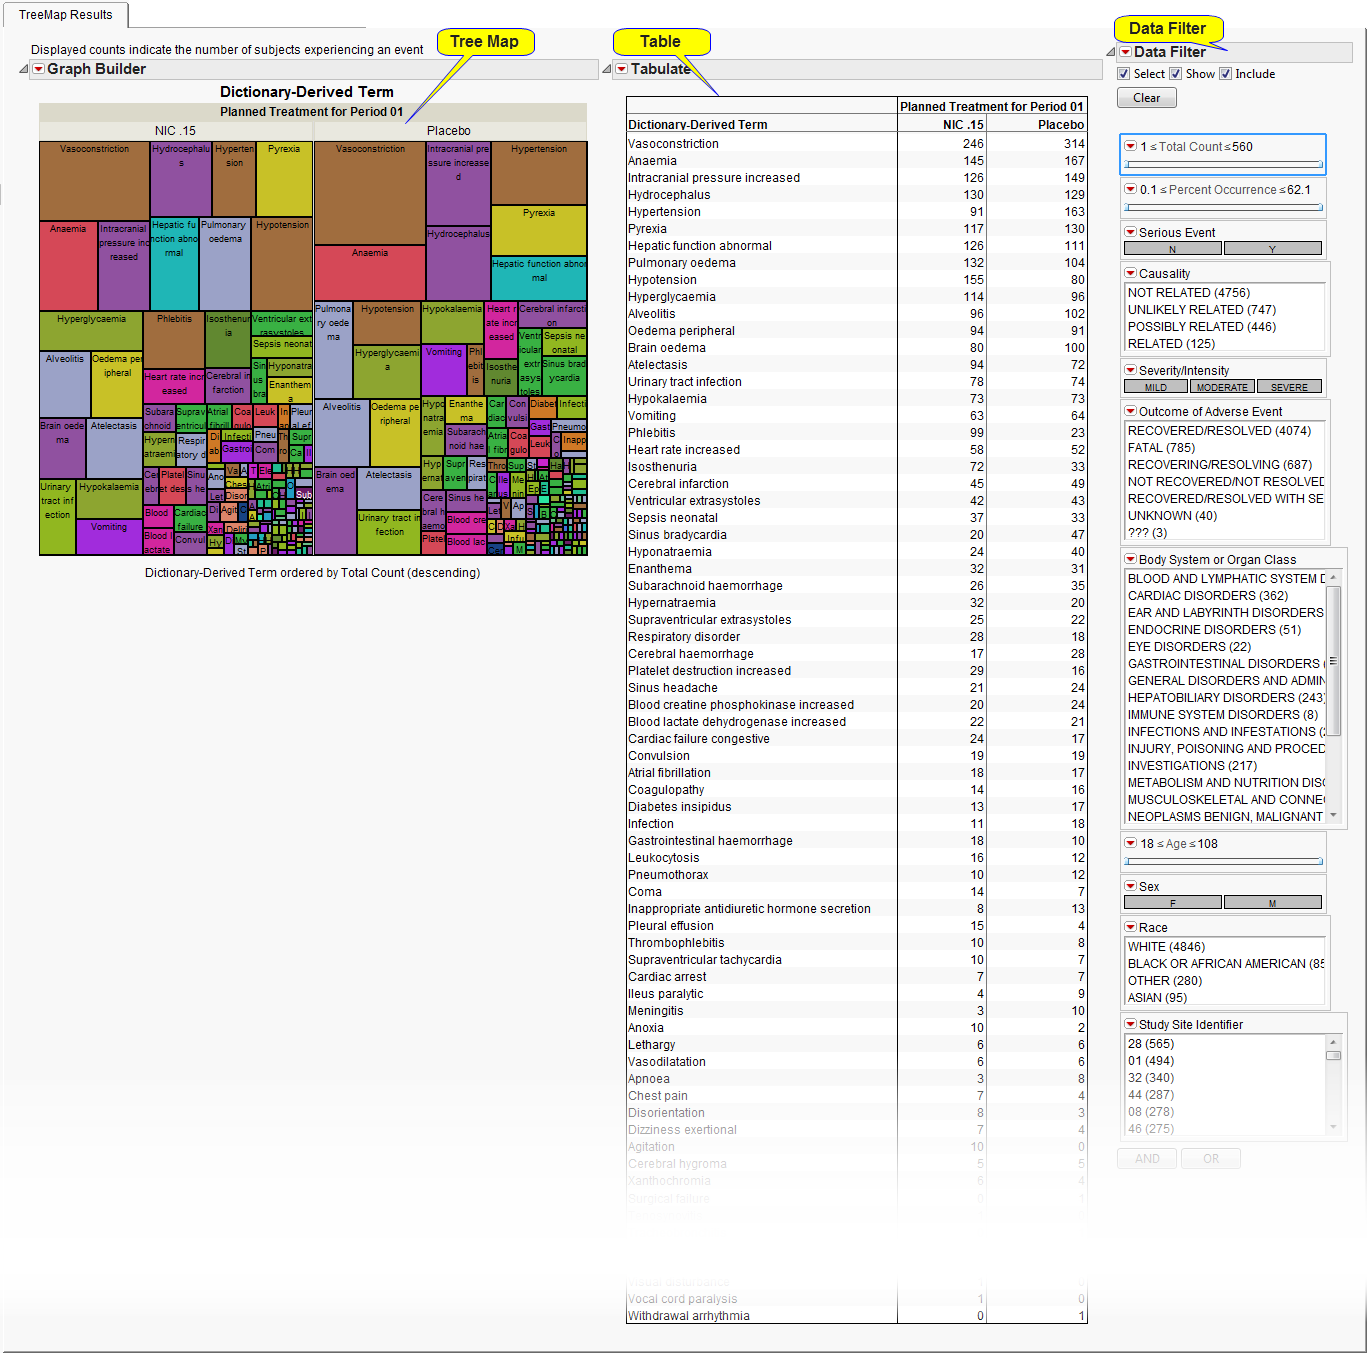
tab contains the following elements:
Adverse Events
are grouped initially by
Trial Time Windows
, which can be changed by the
Column Switcher for TreeMap Tabs
. Cells are colored to distinguish event type, and sized based on the number of subjects experiencing the event for the particular column value. Should
Count multiple occurrences of an event per subject
be selected, sizes represent the total number of events occurring. The
Interventions Distribution
process has a similar option for
Count multiple occurrences of an intervention per subject
.
See
Graph Builder
for more information.
|
•
|
One
Table
.
|
Rows of the Table represent events, whereas column is initially
Trial Time Windows
. (Column can be changed by the
Column Switcher for TreeMap Tabs
). Values in the table represent the number of subjects experiencing the event for the particular column value. Should
Count multiple occurrences of an event per subject
be selected, values represent the total number of events occurring. The
Interventions Distribution
process has a similar option for
Count multiple occurrences of an intervention per subject
.
See
Tabulate
for more information.