This tab presents a series of interactive
Distribution
s that summarize where in the analysis that the
variables
are used, whether they are required, the
dialog
options and settings that use the variables.
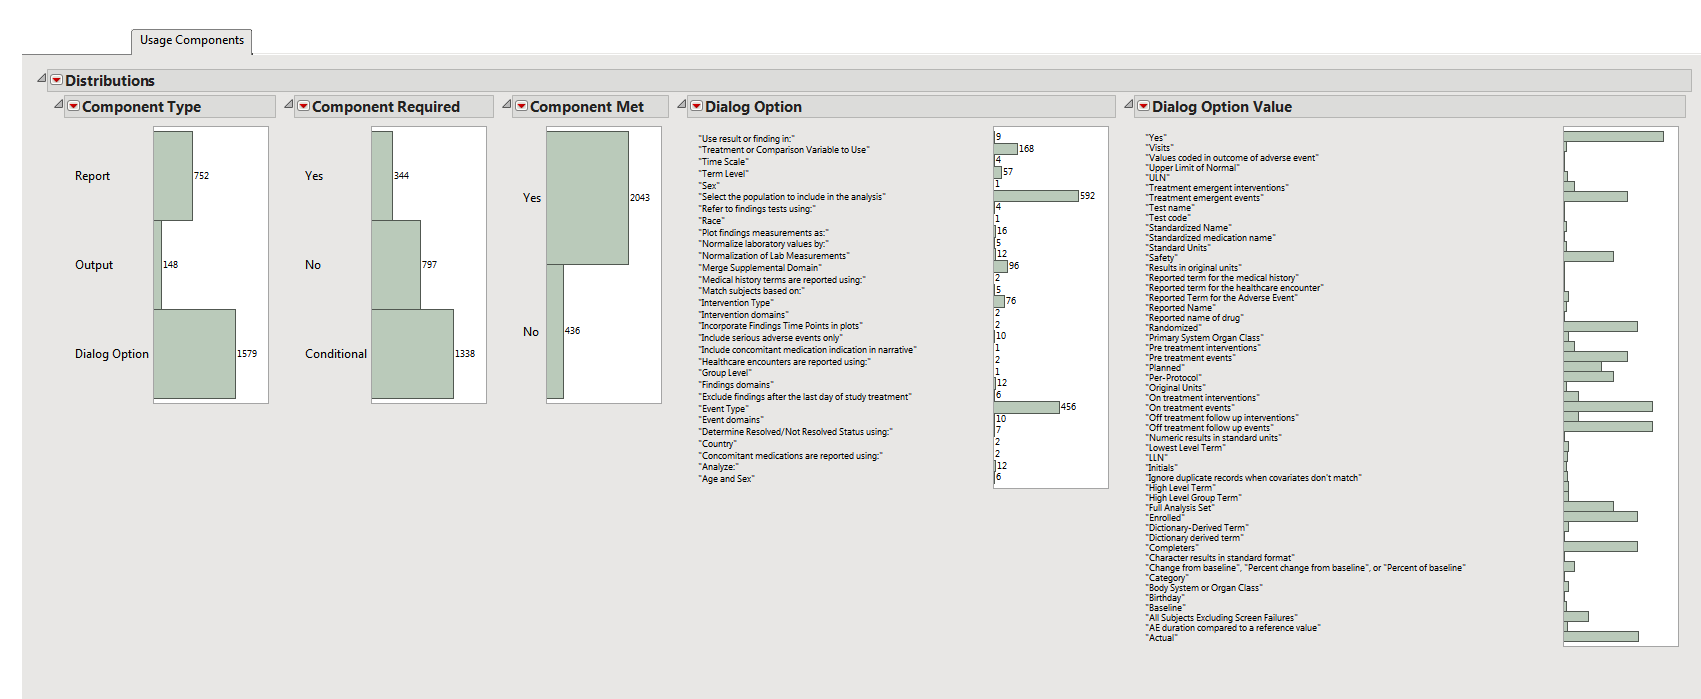
|
|||
Note
: The distributions on this tab are interactive. If you highlight one bar in any distribution, the all of the other bars in all of the distribution might also be highlighted, depending on whether they contain one or more variables represented by the first bar. The relative proportion each subsequent bar is highlighted is dependent on the number of affected variables that it contains. Moreover, the corresponding rows in the master data table above are highlighted. You can generate a subset of the master data table, by double-clicking on the highlighted bar.