The
Waterfall Plots
section is shown below.
|
•
|
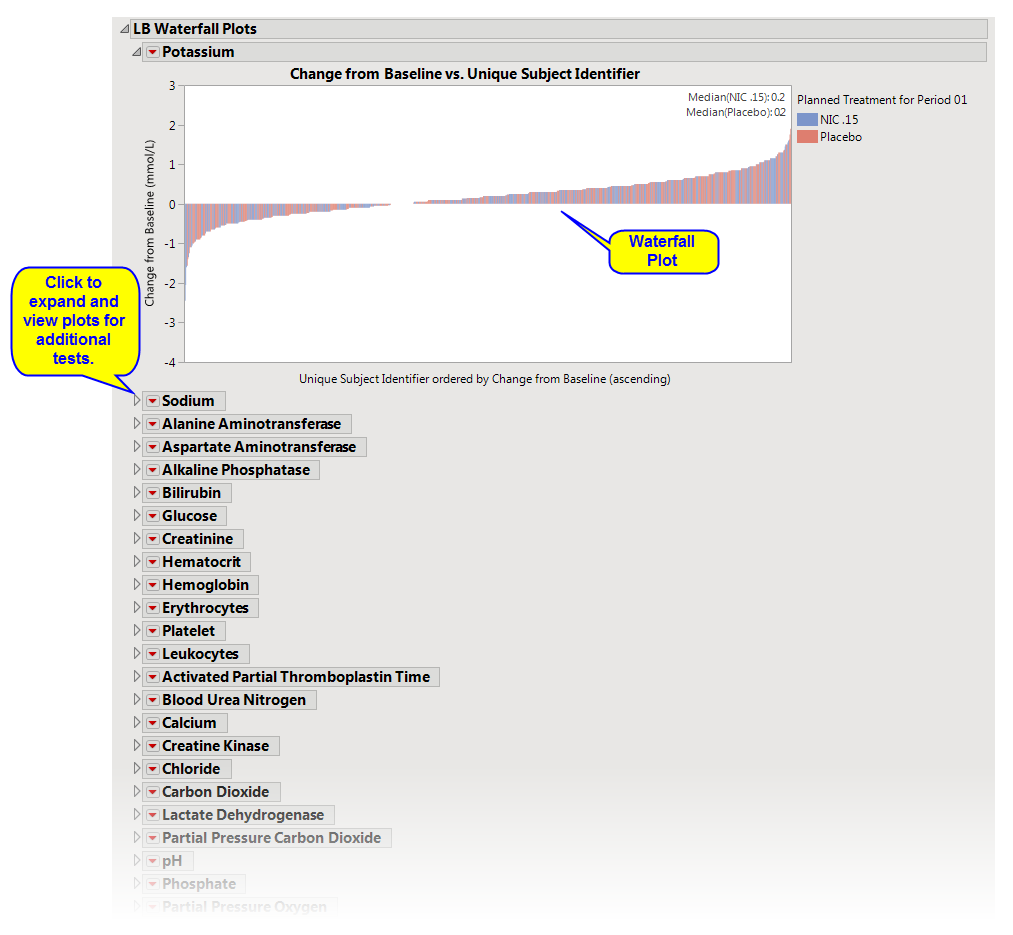
There are a series of
Waterfall Plot
s. Each plot shows a summary of the findings test measurements on the
Y
axis for each subject (on
X
axis) ordered by that measurement. Caption boxes in the upper right corner of each graph (optional) display a summary statistic across all subjects (in a treatment or
BY variable
group) to aid in understanding the differences in the center/spread of the group
distributions
.
|