Options for visualizing cross-over analysis are on the
Findings Time Trend
dialog include
Overlay visits when treatment crossover is detected
and
Pool subjects in average time trend plots when treatment crossover is detected
. Both options are located on the
Output
tab of the report dialog. These options are discussed in more detail below.
Check the
Overlay visits when treatment crossover is detected
check box
to overlay visits when treatment crossover is detected for subjects.
Caution
: You should check this box only if you want to overlay findings trends across the same time points (if detected) for treatments from different visits. Treatment crossover periods must coincide with Visits or unexpected results might occur. When this option is checked, any information about which treatment a subject was given at a visit is no longer discernible.
Check the
Pool subjects in average time trend plots when treatment crossover is detected
check box to pool subjects across treatment periods in the average time trend plots when a treatment crossover is detected. This results in the display of the average time trend plots for each unique treatment value across all treatment periods.
|
•
|
When neither the
Overlay visits when treatment crossover is detected
box nor the
Pool subjects in average time trend plots when treatment crossover is detected
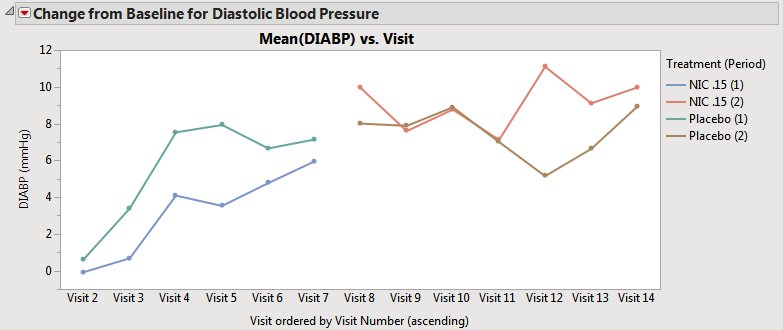
box is checked, the average time trends view has one connected line representing the average for that treatment across all periods (assuming that the treatment value is coded with the same value across periods). Treatment values that changed across treatment periods still have separate lines at the moment of crossover (shown below). Note that in this case, this does not change the composition of the subjects used for calculating the
means
.
|
|
•
|
When the
Pool subjects in average time trend plots when treatment crossover is detected
box is checked, but the
Overlay visits when treatment crossover is detected
box is not checked, the subjects that have the same value for treatment across different periods are pooled to calculate the average trend across the visit(s). For example, subjects assigned to Placebo on period 1 are pooled with subjects assigned to Placebo on period 2, and only one line is displayed for Placebo, as shown below.
|

Note
: When the
Pool subjects in average time trend plots when treatment crossover is detected
box is not checked but the
Overlay visits when treatment crossover is detected
box is checked, two separate lines would be drawn for Placebo (1) and Placebo (2) (not shown).
|
•
|
When Subject-level Time Trends Results are generated (occurs when the
Plot average time trends across treatment groups
bow is unchecked), the results are same regardless of whether the
Pool subjects in average time trend plots when treatment crossover is detected
option is checked or not.
|

Note
: Plots of the results obtained when the
Overlay visits when treatment crossover is detected
box is checked are not shown here because the example data does not contain time points.