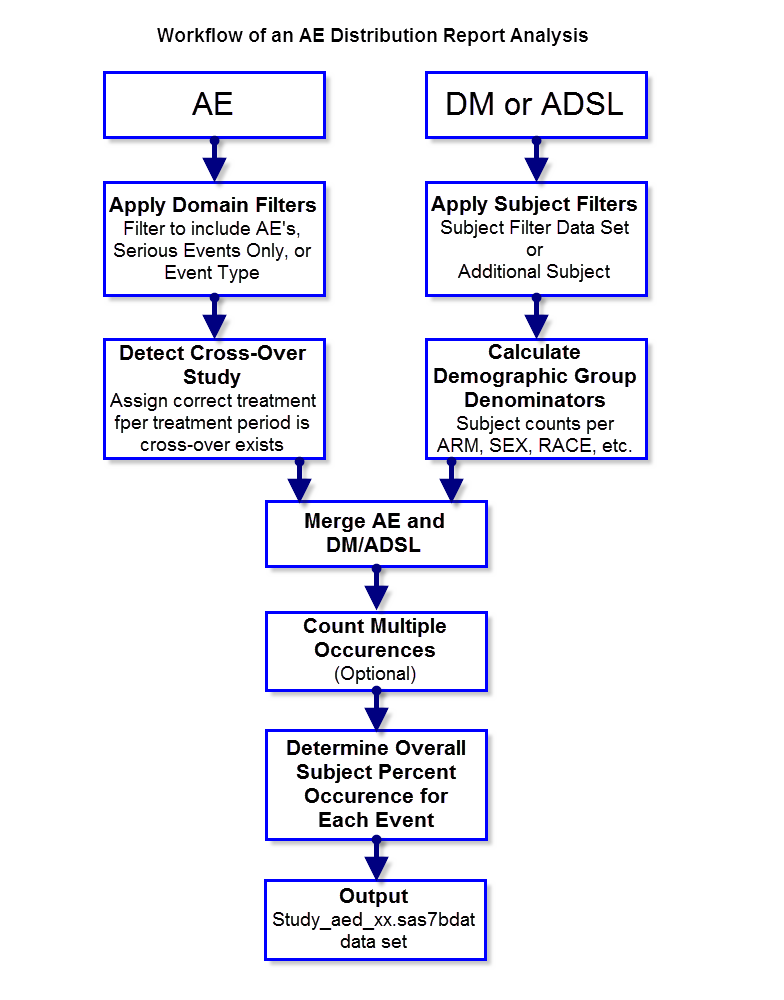
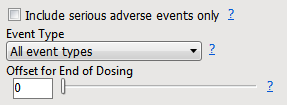
Three parameters,
Include serious adverse events only
,
Event Type
and
Offset for End of Dosing
, are used to specify a domain filter.
|
|||
|
Event Type
options rely on the available
Date/Time
start and end variables referenced above. Options include:
|
|||
|
|||
|
|||
|
|||
You can also use the
Include the following adverse events:
and
Filter to Include Adverse Events
options based on user-customized condition and/or on new/modified/stable records (when JMP Clinical snapshot comparison is being used)
Three parameters,
Subject Filter
,
Additional Filter to Include Subjects
and
Select the population to include in the analysis
, are used to specify a domain filter.
|
|||
|
|||
If an
ADSL
table is defined and contains multiple treatment periods (
TRTxxP
for example) and treatment period start/stop dates,
ADSL
is merged in and the corresponding treatment and period is assigned based on comparison with
AESDTC
.
Note
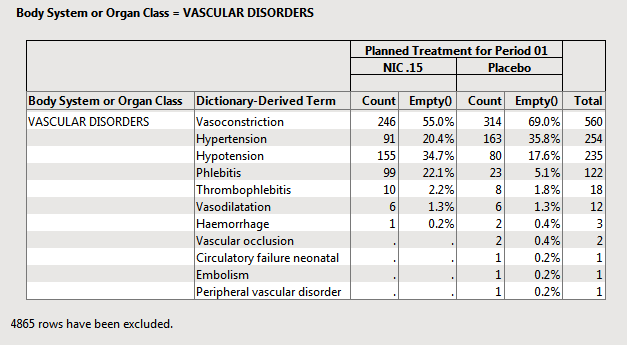
: If you want to output static AE percent tables only, the
Adverse Event Report
menu command should be run.
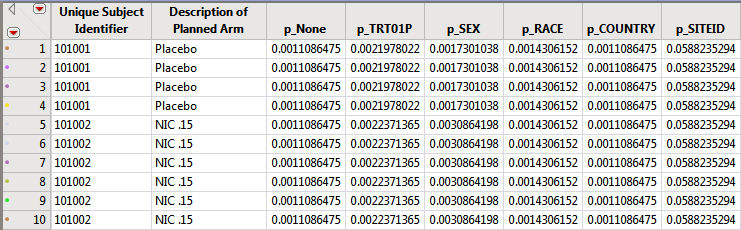
The subject counts for each value of relevant demographic variables (
Treatment
,
SEX
,
RACE
,
COUNTRY
,
SITEID
,
STUDYID
(if not constant) are computed and then the reciprocal of the subject count is recorded in the DM or ADSL data set for merging into AE. This value can be used as a frequency weight for each subject that has a specific event to calculate the percent of subjects for that given demographic group that experience the AE.
Note
: If cross-over is detected, these demographic counts represent the total subjects for EACH treatment period.
The (filtered)
AE
data and the (filtered)
DM
or
ADSL
table (with computed demographic frequencies) are merged by
USUBJID
(and treatment period if cross-over is detected)
This option is turned
OFF
by default.
Percent calculations are performed only if this option is UNCHECKED so that when a unique event is counted only once per subject, you can interpret the frequency of AE counts as the percentage of subjects experiencing the event. The representative adverse event is chosen based on Seriousness (
AESER
if exists), Severity (
AESEV
), and computed study day (
AESTDY
or based on
AESDTC
)
Note
: JMP Clinical assumes accordance with controlled terminology: "Y" to represent severe events, and "MILD", "MODERATE", "SEVERE" to select the serious, most severe event as representative.
For other events/interventions, the representative unique occurrence is chosen based on the first occurrence. The following help documentation for the
Count multiple occurrences of an event per subject
check box
option describes the result of this option.
|
Each subject contributes only
one
time to the occurrence count of an intervention, regardless of how many times that specific intervention might have been applied to the subject.
Note
: Representative intervention occurrence per subject is selected by sorting the data and taking the
first
intervention occurring to a subject based on Study Day.
|
|
|
Compute counts based on the overall counts of interventions, including
multiple
occurrences per subject.
|
After all of these steps have been completed, the
STUDY_ae_xx.sas7bdat
results table is used for the JMP results dashboard report.