|
•
|
Distributions of the event/intervention, descriptive variables about the event/intervention (for example, for AEs this could include
Body System
, Seriousness, Severity, Causality, Outcome, Action Taken, and so on), and demographic distributions of subjects experiencing the event/intervention
|
|
•
|
Column Switchers
: Choose the grouping variable used as the demographic comparison for the counts plot and table and a stacking variable to categorize events/interventions (especially useful with adverse events).
|
|
•
|
: Generates Patient Profiles for subjects experiencing selected events.
|
|
•
|
: Subsets and opens
ADSL
(or
DM
, if ADSL is unavailable) for subjects experiencing selected events. A Table of
USUBJIDs
is also presented.
|
|
•
|
: Clusters subjects experiencing selected events based on available
covariates
.
|
|
•
|
: Creates a data set of
USUBJIDs
for subjects experiencing selected events, which subsets all subsequently run
processes
to those selected individuals. The currently available filter data set can be applied by selecting the Subject Filter data set in any process dialog on the Filters tab.
|
|
•
|
(AE/Events Distribution only): For subjects experiencing selected events, this drill-down launches
Interventions Distribution
to summarize the distribution of concomitant medications (
CM
).
|
|
•
|
: For subjects experiencing selected events, this drill-down generates a stacked Histogram to show subjects across study sites by
Trial Time Windows
.
|
|
•
|
: For subjects experiencing selected events, this drill-down launches
Findings Time Trends
to summarize laboratory results (
LB
) across time.
|
|
•
|
: For subjects experiencing selected events, this drill-down launches
Findings Time Trends
to summarize vitals signs (
VS
) across time.
|
|
•
|
: For subjects experiencing selected events, this drill-down launches
Findings Time Trends
to summarize ECG measurements (
EG
) across time.
|
|
•
|
(Interventions Distribution only): For subjects taking selected medications, this drill-down launches
AE Distribution
to summarize the distribution of adverse events (
AE
).
|
|
|
Open
AE Distribution
.
|
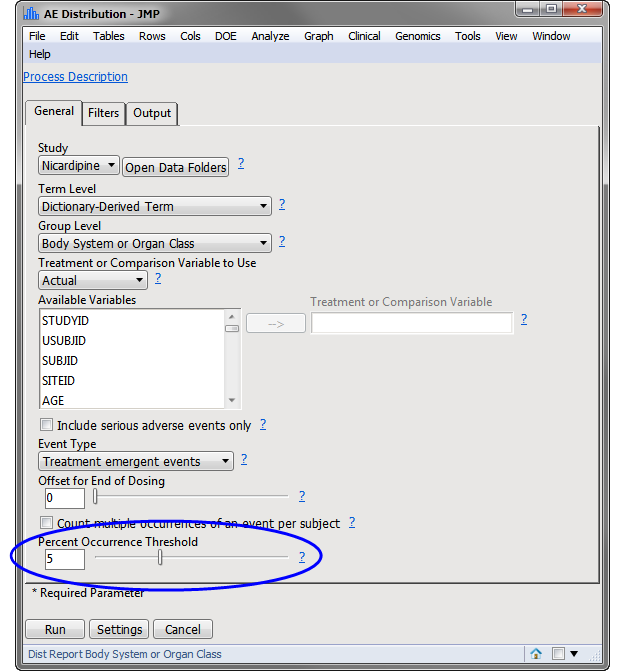
Note
: The most significant change made in this example is that the
Percent Occurrence Threshold
has been adjusted from
0
to
5
(circled above).
|
|
Click
.
|
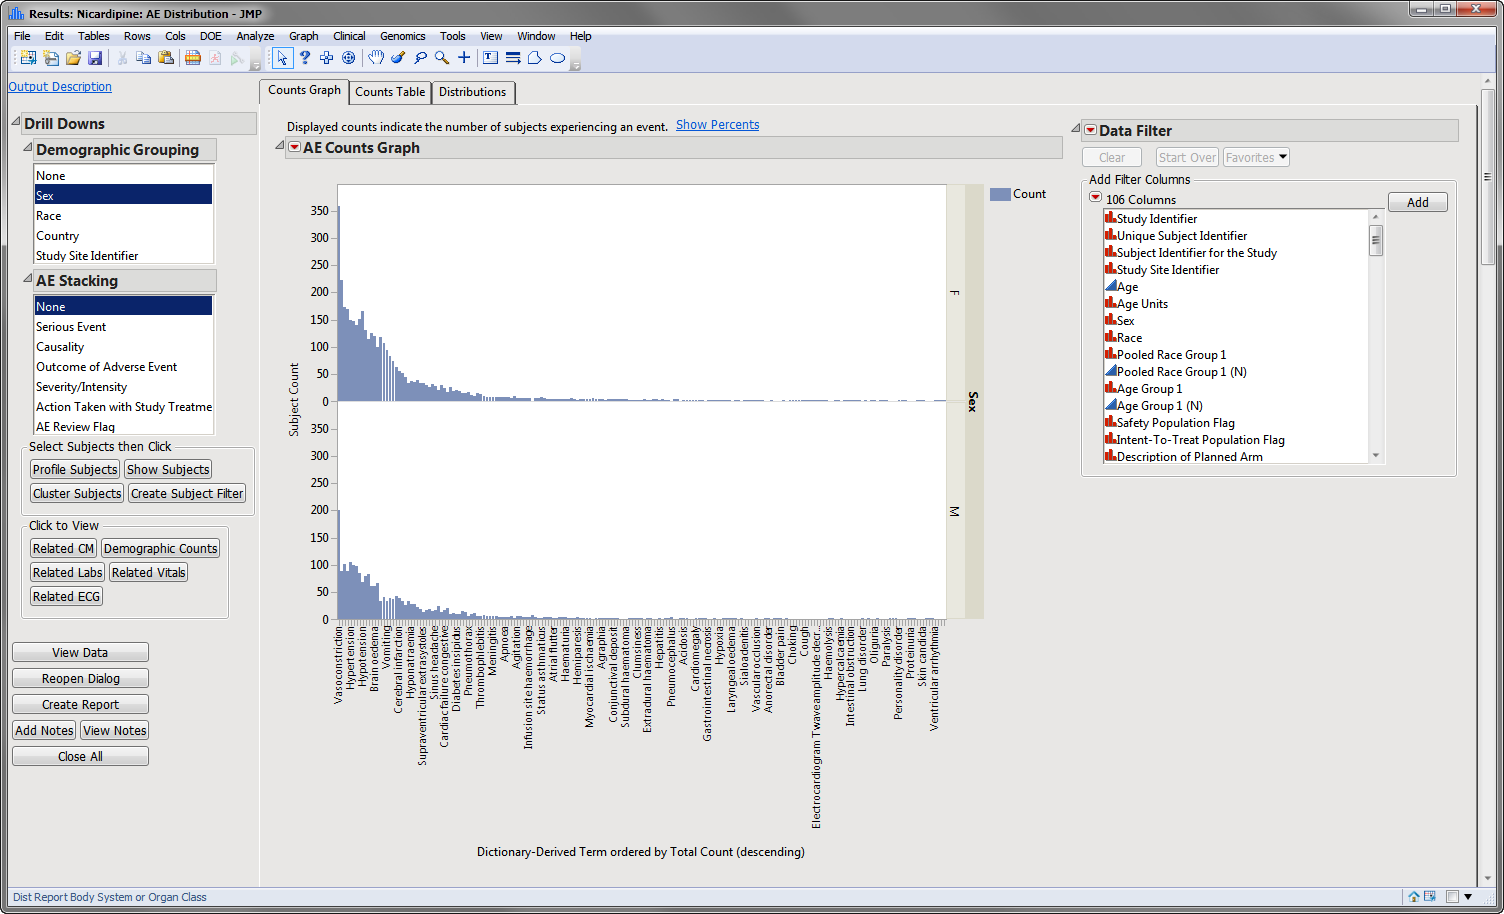
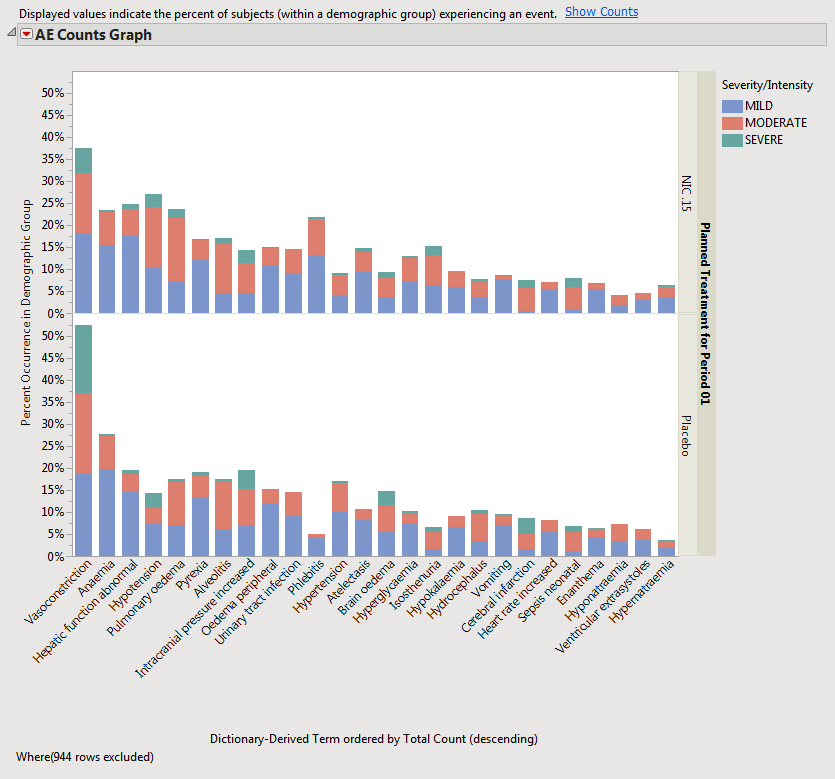
The results of this analysis are based on summarizing adverse events by Dictionary-Derived Term (
AEDECOD
) with group organization as
Body System
or Organ Class (
AEBODSYS
). Variations of options for this are dependent on the available terms in the domain data set.
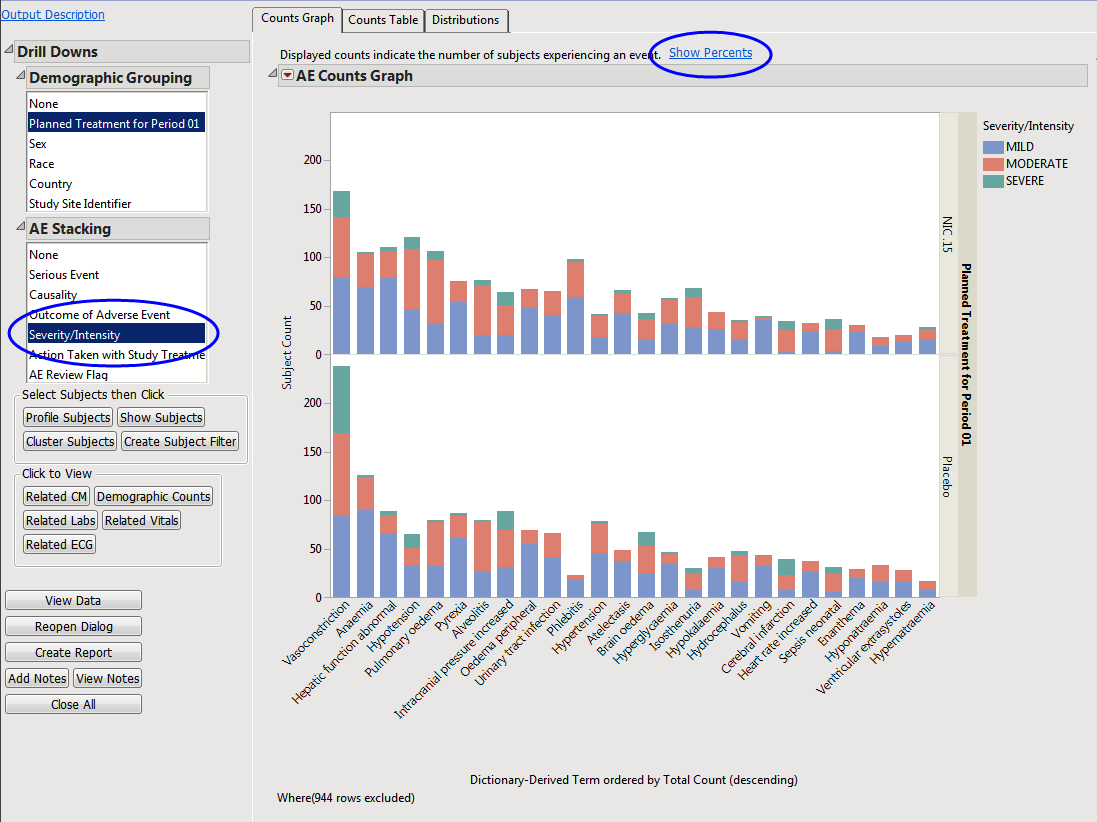
The counts (
Y
-axis) represent the count of subjects that experienced the given event term (
X
-axis); the counts are categorized as stacked
bar charts
for levels of
Severity/Intensity
(
AESEV
). This categorization is a result of choosing that variable from the
AE Stacking
drill-down.
When a unique occurrence is counted only for each subject/event, the percent of subjects experiencing an event within any of the available demographic grouping variables is calculated interactively by the report. The plot below was generated by clicking
Show Percents
(circled above).

The output
STUDY_aed_xx.sas7bdat
data set used to generate these plots and tables contains a row for each subject experiencing each event (optionally by treatment period in a cross-over scenario).

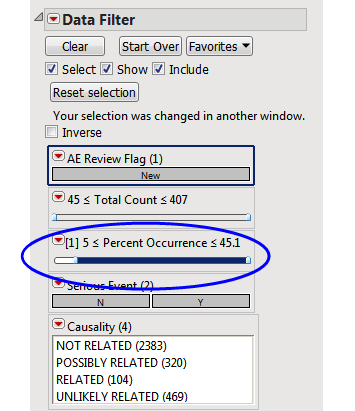
Rows that do not meet the
Percent Occurrence Threshold
specified on the dialog (5% in this example) are hidden and excluded from analysis. This filter can be interactively changed using the
Data Filter
option for
Percent Occurrence (circled below)
.