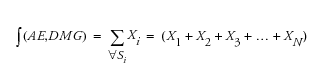
N
= Subject number
Note
:
X
i
=1 if the
i
th subject
Si
is in the DMG (demographic group) and has an AE value on at least one occasion. If these conditions are not met,
X
i
has a value of 0.
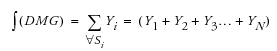
N
= Subject number
Note
:
Y
i
=1 if the
i
th subject
Si
is in the DMG (demographic group). If not,
Y
i
has a value of 0.

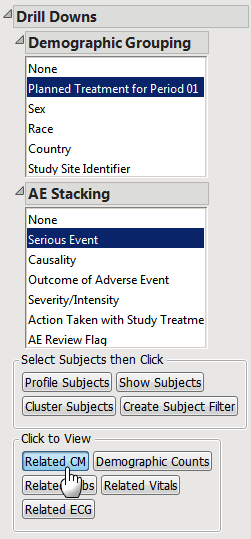
Example 1
: Using the Drill-downs on the Output dashboard, select
None
for
and
None
for
and examine the
Counts Table
tab.
Example 2
: Using the Drill-downs on the Output dashboard, select
Planned Treatment for Period 1
for
and
None
for
and examine the
Counts Table
tab. Note how the values change.
Example 3
: Using the Drill-downs on the Output dashboard, select
Planned Treatment for Period 1
for
and
Severity/Intensity
for
and examine the
Counts Table
tab. Note how the values change.
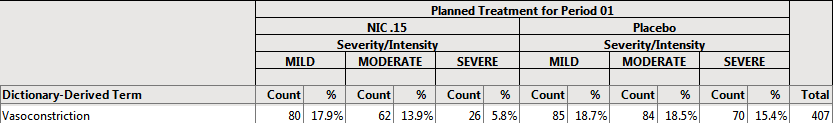
Note
: In the example, the demographic group column changes the percent calculations (aka changes the value of the denominator used in the formula), while the stacking/categorization variable just partitions the counts and percentages.
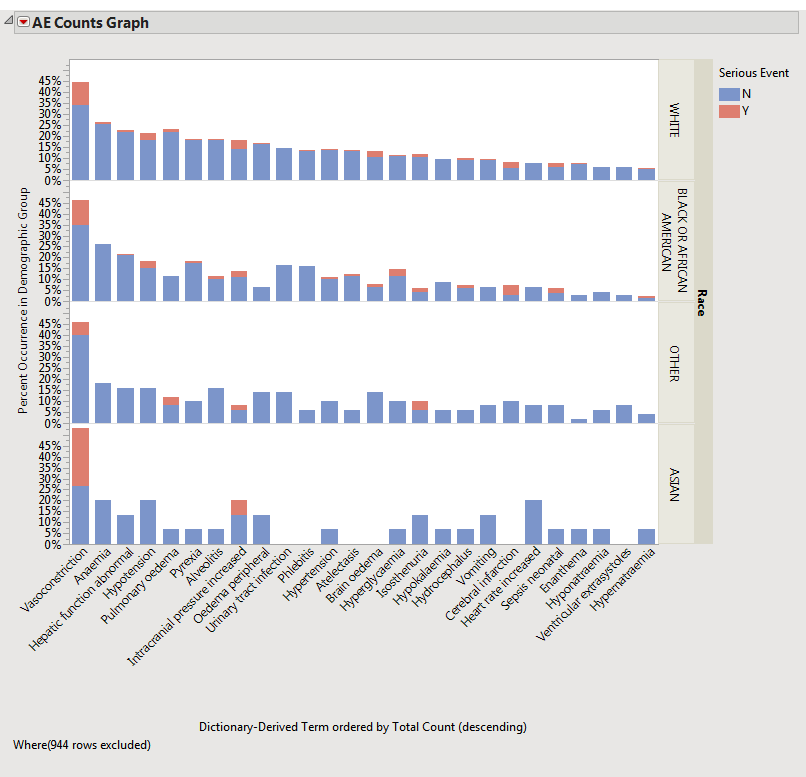
The value of percent calculation comparison can be seen clearly in the two plots shown below. The first plot shows the AE Counts graph grouped by
RACE
and categorized by
Serious Event
.

|
|
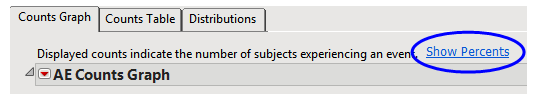
Click
Show Percents
(located above the plot and circled below).
|
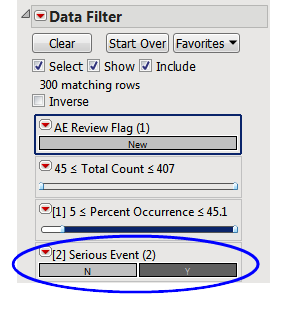
When you use the
(located on the right side of the report) to filter the records that are shown, the change does NOT affect the demographic group denominator values that are used in the percent calculations. These denominators, as described previously, are derived in the SAS programming of the analysis based on the analysis population. The counts (the numerator in the percent formula) of subjects experiencing the event (and now meeting the data filter criteria) change values to reflect the use of the data filter.
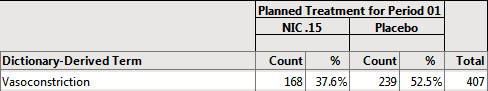
In the following example, the default (Event Type = All)
AE Distribution
report was run for the Nicardipine sample data and the results were subsequently filtered for Serious Event =
Y
, as shown below:
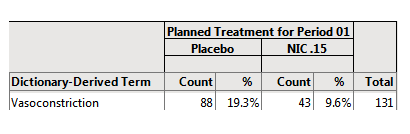
88/455 = 19.3% of subjects on Placebo experienced
serious
vasoconstriction.
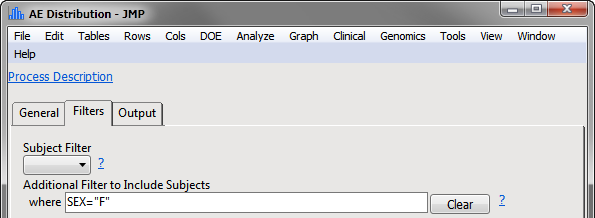
In the following example, Sex =
F
has been selected in the data filter:
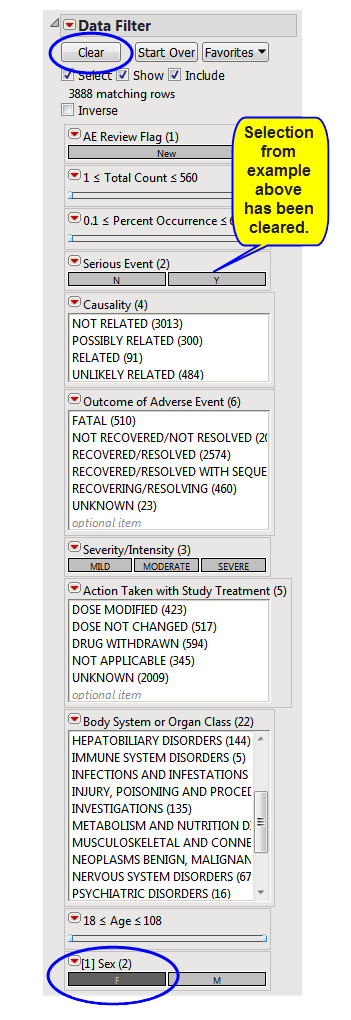
Note
: You must click
(circled above) to clear out prior filters before making a new selection.
Note
: If you want to have such demographic filters reflected in the reference population, a pre-specified filter should be used up front, as described below.
For example, on the
AE Distribution
dialog, you can:
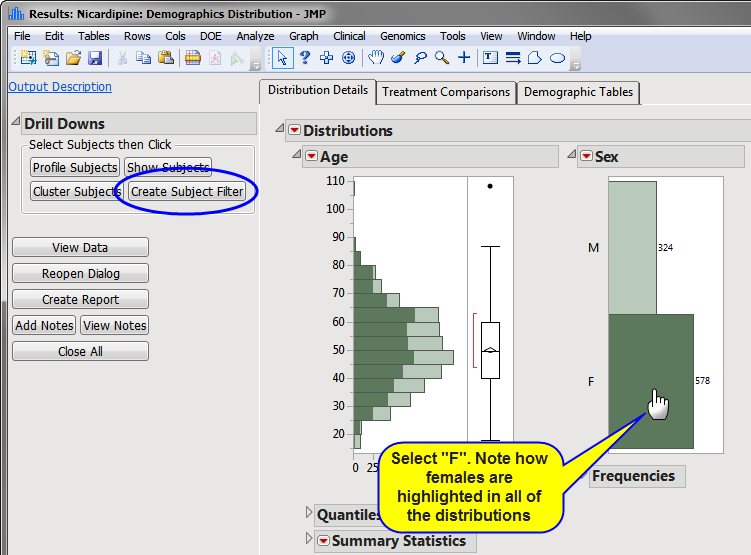
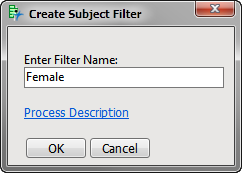
Example 1
: Generate a
Subject Filter
of only females:
|
|
Run
DM Distribution
Report.
|
|
|
Select
F
category in SEX distribution bar chart (or from the data filter). Note how the females are highlighted in all of the distributions.
|
|
|
Click the
Drill Down button (circled above).
|
|
|
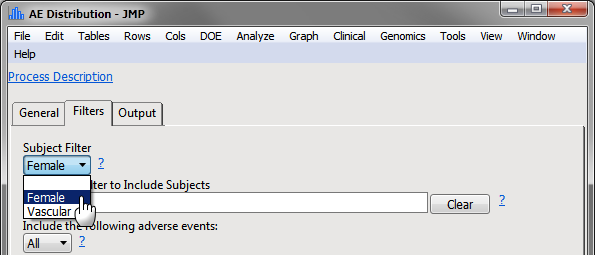
Specify this filter as a
Subject Filter
in the AE Distribution dialog
|
|
|
Click
.
|
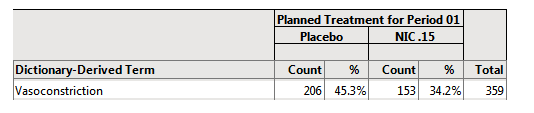
When filtering is applied
up front
, the percent values and their interpretation are based on females only:
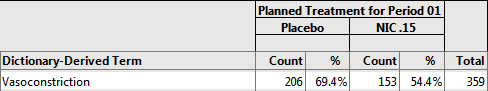
In this example, the 297 female subjects on placebo make up the denominator of the percent calculation. The females showing vasoconstriction represent the subject count (or numerator) that had the event (206 female subjects that had vasoconstriction). In this case, where filtering is applied
BEFORE
the analysis, the percent calculation (206/297 = 69.4%) represents the number of females showing vasoconstriction out of
FEMALE subjects only
on Placebo.
In the example described above, the 455 subjects (male and female) on placebo make up the denominator of the percent calculation. The females s represent the subject count (or numerator) that had the event subject to any data filter specification (206 female subjects that had vasoconstriction). In this case, where filtering is applied
AFTER
the analysis, the percent calculation (206/455 = 45.3%) represents the number of females showing vasoconstriction out of
ALL subjects (not just females)
on Placebo.
The examples described, while highlighting the
AE Distribution
report heavily, also reflect the analyses performed by the other events/interventions distributions.
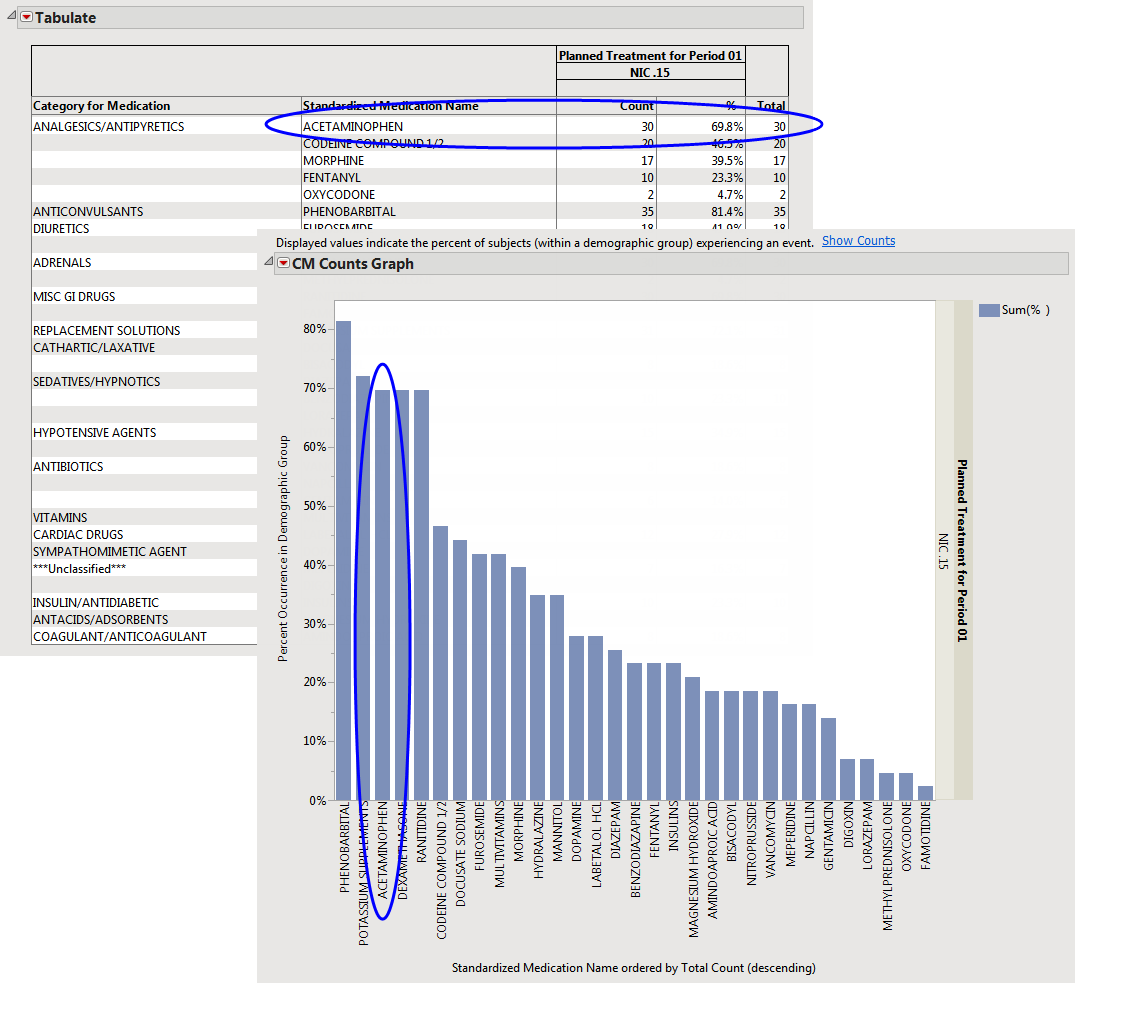
For example, if you run the
AE Distribution
report using the Nicardipine example that is shipped with JMP Clinical and select Serious Event using the
AE Stacking
drill-down, you see the following
Counts Table
.

|
|
Click
, as shown below.
|
JMP Clinical runs the concomitant medications
Interventions Distribution
report for the 43 selected subjects.
If you click
Show Percentages
on the dashboard, you see the Counts Graph and Counts Table shown below: