All distributions (
AE Distribution
,
Events Distribution
,
Interventions Distribution
, and
Findings Distribution
) also include a set of distributions of relevant results variables in the report.
For the
Findings Distribution
report, these distributions are the initial view. The findings calculations follow the same workflow as described by the events computation, but are simpler because no percent calculations are performed. Most of the analyses are derived using the JMP reports.
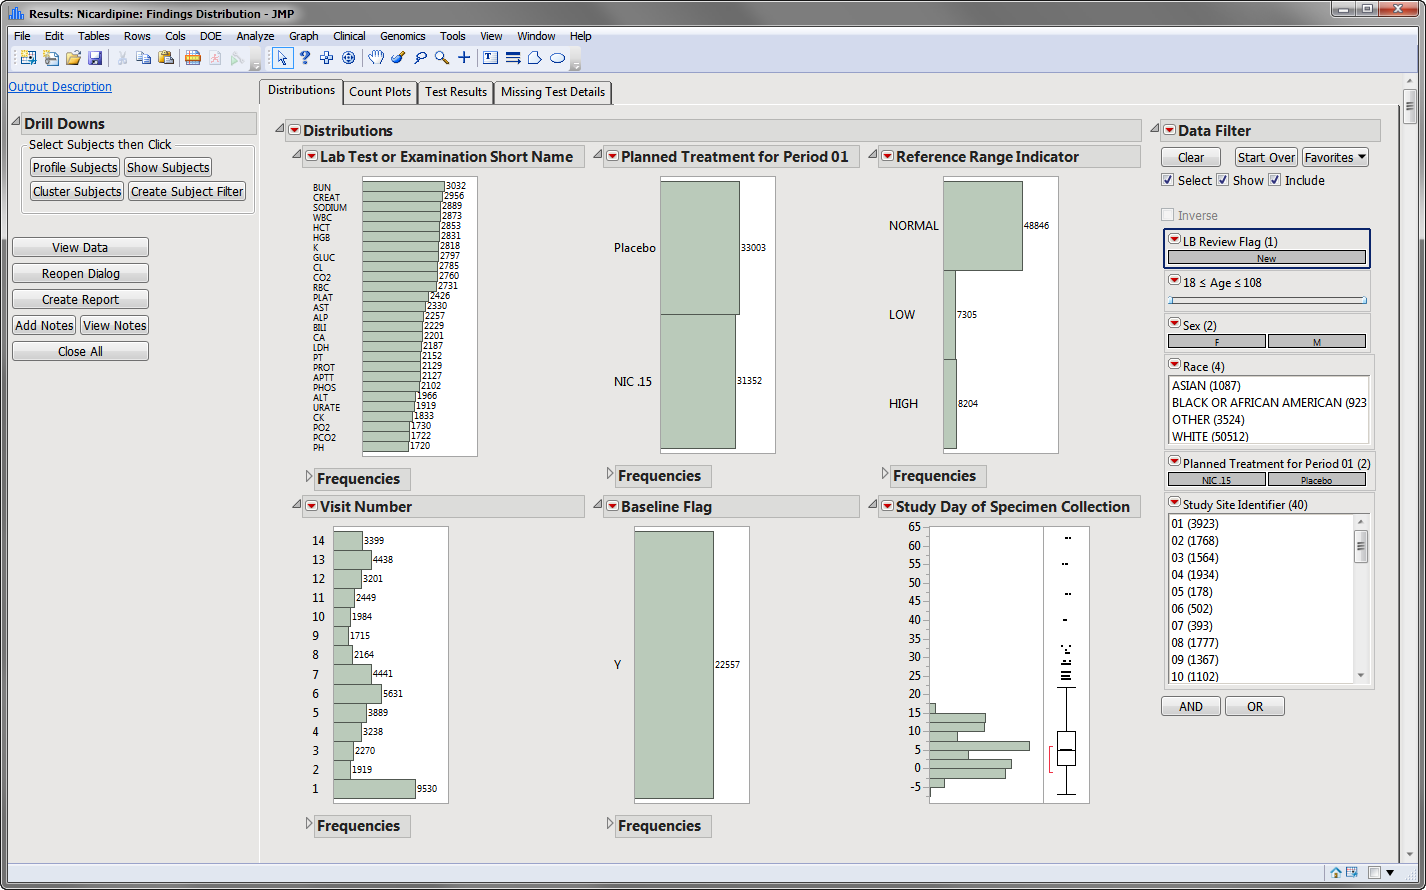
The
Findings Distribution
report might contain the following results:
|
•
|
Distributions
: Contains distributions of parameters from the specified Findings domain.
|
|
•
|
Count Plots
: Contains graphs for each test to display measurement counts within categories of the
Reference Range Indicator
variable. This tab is displayed only if the
xxNRIND
variable is present in the Findings domain data (typically the
LB
domain).
|
|
•
|
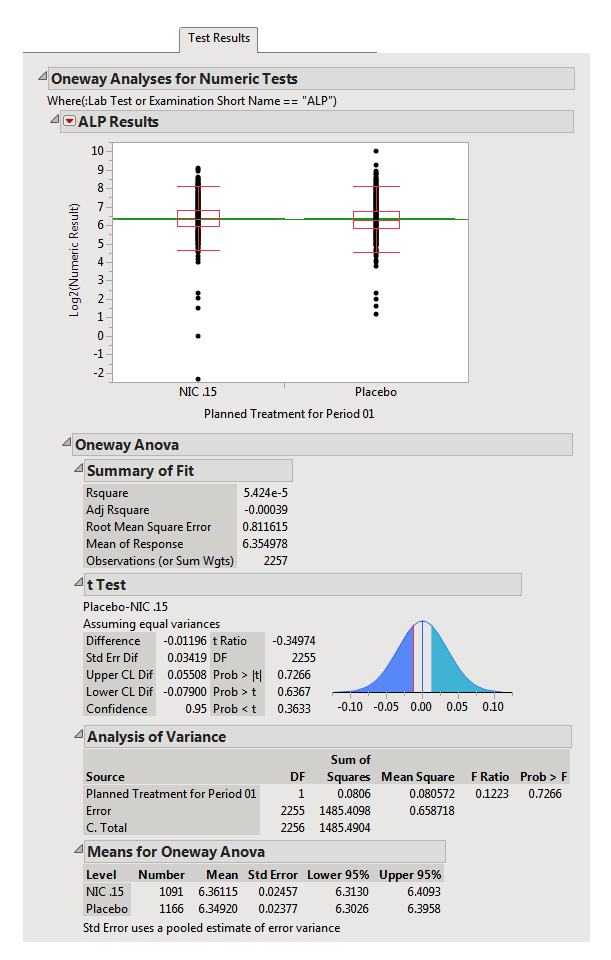
Test Results
: Contains One-way Analyses (
ANOVA
) for each test that has numeric measurement results (
xxSTRESN
values), Contingency Analyses for each Findings test that has character results (
xxSTRESC
values but missing
xxSTRESN
values), or both.
|
|
•
|
Missing Test Details
: Contains tables displaying subject counts for tests that were either not recorded, or that were recorded but have missing measurement values (of
xxSTRESN
and/or
xxSTRESC
). If all subjects had nonmissing recorded test measurements for all tests, this tab is not shown.
|
The
Distribution
tab is shown above. The other three tabs are shown below:
Count Plots:
This plot shows counts of records from the Findings domain by Study Visits. The
xxNRIND
and either the
VISIT
or
VISITNUM
variables are required in the domain in order to produce these plots.

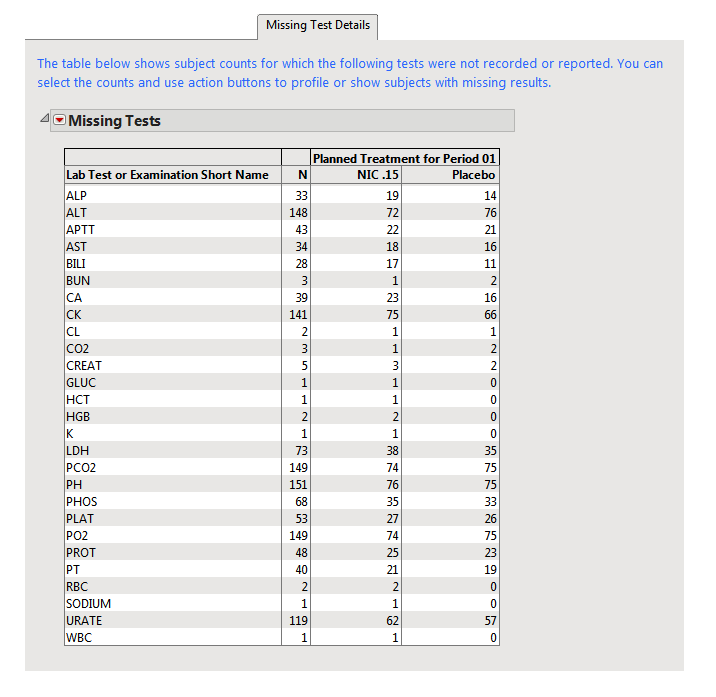
Missing Test Details
; This tab tracks both missing tests and test records that contain
missing values
.
This table displays subject counts for which Findings tests were either not reported or not recorded. For example, the number of subjects that did not have any record taken for the
ALT
lab test in the
LB
domain is displayed in this table for the
ALT
test row.
This table displays subject counts for any Findings test was that was recorded, but has a missing measurement value (missing an
xxSTRESN
value for numeric tests or missing an
xxSTRESC
for categorical tests). This table differs from the Missing Tests Table in that a record was reported for the test for that subject, but the measurement value was missing.