Most large-scale clinical trials use a parallel experimental design in which randomly selected subjects are assigned to one of two or more treatment
Arms
. Once assigned to an Arm, each subject is given a single treatment, either the drug or drugs being tested, or the appropriate control (usually a placebo) for the duration of the study. Data are collected and subjected to
between-patient
analysis. Large
sample sizes
are usually required in these studies to account for the many sources of inter-subject variation, while still enabling accurate detection of any treatment effects.
An increasingly popular strategy for clinical trials, particularly for those involving stable, chronic conditions, involves the use of a crossover design. In this design, every subject is sequentially given all of the treatments in the study. Each treatment is administered for a defined period of time. Each subsequent treatment is preceded by a recovery, or
washout
, period where no treatments are administered, to allow subjects’ conditions to return to their normal states. Patients are randomized only with respect to the order in which the different treatments are administered. Because each subject serves as his or her own control, reducing the effects of between-patient variation, and because each subject can be used multiple times, crossover studies usually require far few subjects, although for longer times, than comparable parallel studies. These benefits can often outweigh the risks (patient drop-out, changing patient condition over time, carryover of one treatment to the next due to insufficient washout, or any secondary effects), associated with this design.
All study information must be recorded using an
ADSL
data set following the
ADaM
standard to support multiple treatment periods.
|
•
|
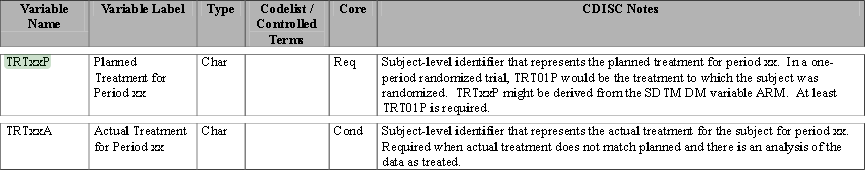
Treatment Variables
TRTxxP
or
TRTxxA
: The Planned or Actual treatment for a given treatment period
xx
(The
TRT01P
,
TRT02P
, for example, would be the variables used to record the planned treatment for a two-period crossover analysis).
|
|
•
|
Timing Variables
(
TRxxSDT
or
TRxxSDTM
) and (
TRxxEDT
or
TRxxEDTM
): Dates or Date/Times in numeric format indicating the start and end dates respectively for each treatment period
xx
.
|
Refer to the
ADaM Implementation Guide
for additional information.
The system detects a crossover if multiple
TRTxxP
or
TRTxxA
variables exist and the associated timing variables for the xx period exist and contain values. Those values might look like the values in the Nicardipine Cross-over sample data set, shown below.
Note
: For clarity, the majority of the
adsl.sas7bdat
columns in the screen shot below above have been hidden using the
Cols > Hide/Unhide
command.
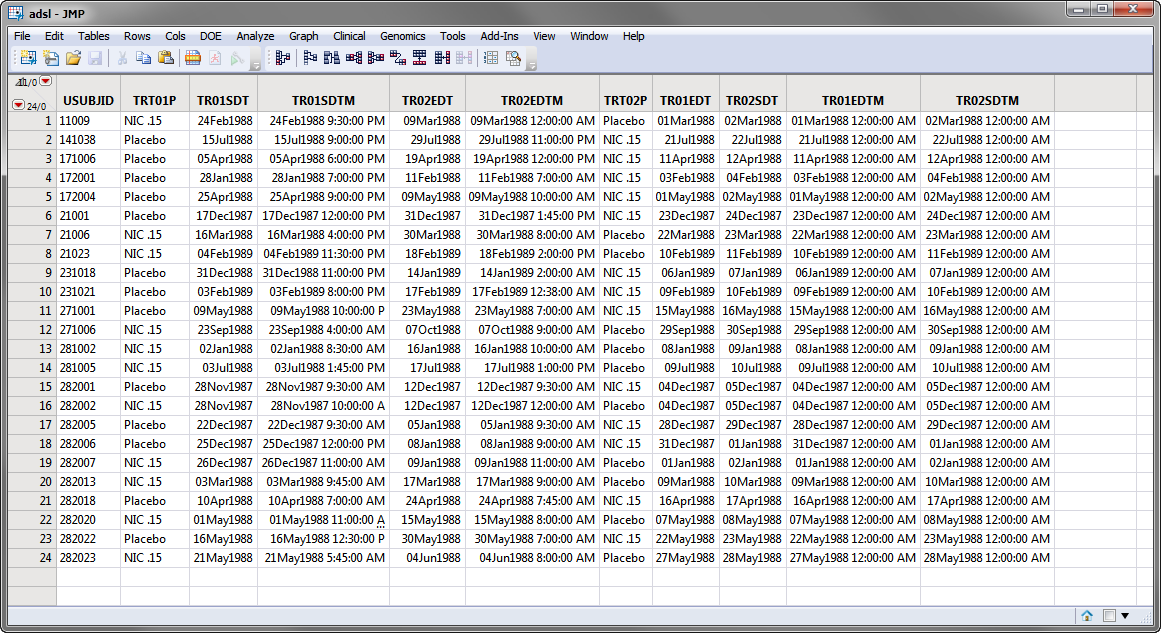
In the screen shot of
adsl.sas7bdat
, shown above, the
SAS variable names
are shown. During the report analysis, when
adsl.sas7bdat
is merged into the relevant analysis domain (for example,
AE
,
LB
,
VS
), the
adsl
treatment timing variables are compared to the timing variable in the domain and new variables:
Treatment
,
Period
, and
Treatment (Period)
are created. The values for these variables are assigned based on the value of the
TRTxxP
or
TRTxxA
and the value of the
xx
in the variable name when the start date of the domain record falls within the treatment period dates.
The
SDTM
data records for a subject can appear as shown in the portion of the
VS
domain (
vs.sas7bdat
(SAS names are being shown)) for the Nicardipine Cross-over sample data set, shown below.
Note
: For clarity, some of the
vs.sas7bdat
columns in the screen shot below above have been hidden using the
Cols > Hide/Unhide
command.
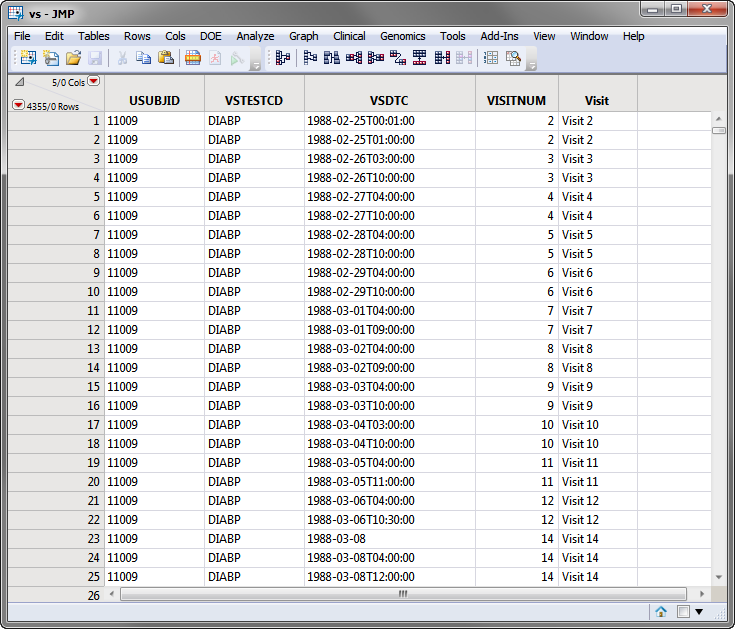
Based on comparison of the
VSDTC
date/time (note that SDTM follows the ISO 8601 date/time standard) with the ADSL timing date/time (numeric SAS date format), the subject records are assigned to the first treatment for Visits 1-6 and the second treatment period for Visits 7-14.
Similar analyses are done for events and intervention domains. In these domains, the timing comparisons for the record is based on the start date/time. For example, with the AE domain the AESDTC variable is used to assign the treatment period; indicating that the
adverse event
must START within the treatment period in order to be assigned that treatment value.
A sample Nicardipine Crossover analysis is now shipped with JMP Clinical. This can be loaded (using the
button) from the
Add Study from Folders
dialog
from the Clinical Starter Menu.
Options for visualizing cross-over analysis are on the
Findings Time Trend
dialog include
Overlay visits when treatment crossover is detected
and
Pool subjects in average time trend plots when treatment crossover is detected
. Both options are located on the
Output
tab of the report dialog. These options are discussed in more detail below.
Check the
Overlay visits when treatment crossover is detected
check box
to overlay visits when treatment crossover is detected for subjects.
Caution
: You should check this box only if you want to overlay findings trends across the same time points (if detected) for treatments from different visits. Treatment crossover periods must coincide with Visits or unexpected results might occur. When this option is checked, any information about which treatment a subject was given at a visit is no longer discernible.
Check the
Pool subjects in average time trend plots when treatment crossover is detected
check box to pool subjects across treatment periods in the average time trend plots when a treatment crossover is detected. This results in the display of the average time trend plots for each unique treatment value across all treatment periods.
Note the following differences in output depending on whether the
Overlay visits when treatment crossover is detected
is checked:
|
•
|
When neither the
Overlay visits when treatment crossover is detected
box nor the
Pool subjects in average time trend plots when treatment crossover is detected
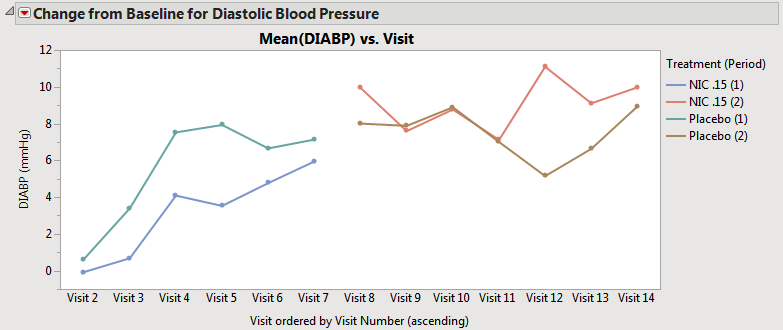
box is checked, the average time trends view has one connected line representing the average for that treatment across all periods (assuming that the treatment value is coded with the same value across periods). Treatment values that changed across treatment periods still have separate lines at the moment of crossover (shown below). Note that in this case, this does not change the composition of the subjects used for calculating the
means
.
|
|
•
|
When the
Pool subjects in average time trend plots when treatment crossover is detected
box is checked, but the
Overlay visits when treatment crossover is detected
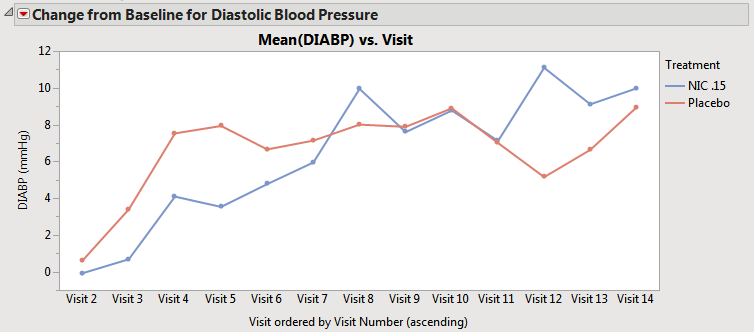
box is not checked, the subjects that have the same value for treatment across different periods are pooled to calculate the average trend across the visit(s). For example, subjects assigned to Placebo on period 1 are pooled with subjects assigned to Placebo on period 2, and only one line is displayed for Placebo, as shown below.
|
Note
: When the
Pool subjects in average time trend plots when treatment crossover is detected
box is not checked but the
Overlay visits when treatment crossover is detected
box is checked, two separate lines would be drawn for Placebo (1) and Placebo (2) (not shown).
|
•
|
When Subject-level Time Trends Results are generated (occurs when the
Plot average time trends across treatment groups
bow is unchecked), the results are same regardless of whether the
Pool subjects in average time trend plots when treatment crossover is detected
option is checked or not.
|

Note
: Plots of the results obtained when the
Overlay visits when treatment crossover is detected
box is checked are not shown here because the example data does not contain time points.
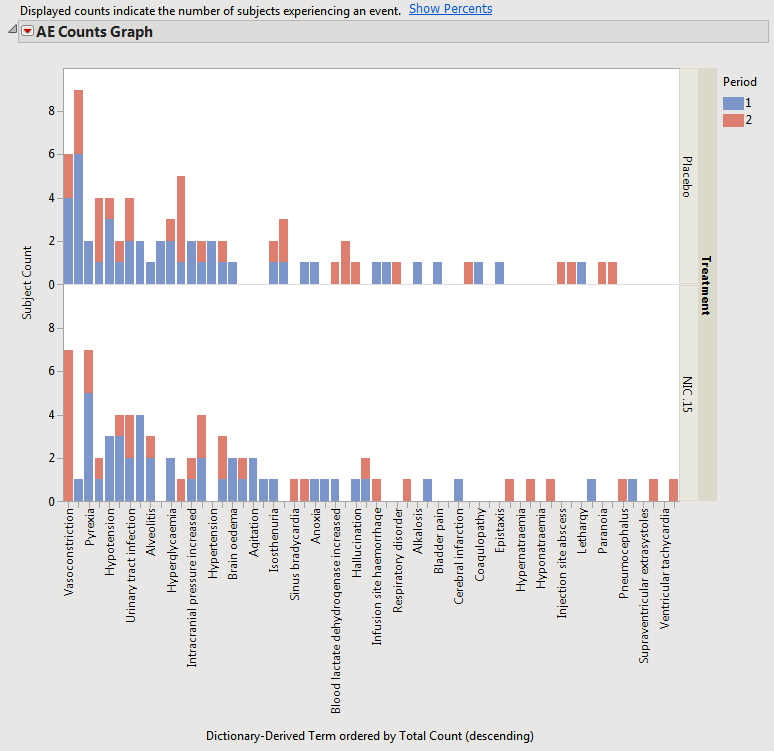
When a cross-over study is detected, the
distribution
results automatically categorizes adverse events by treatment period beginning with JMP Clinical version 5.0.
In the other relevant reports that support cross-over, the results plots in the report are unchanged but treatment period is taken into account in the statistical
model
. For the incidence screen reports, when multiple periods are detected, the
Unique Subject Identifier
is automatically used as a STRATA variable to perform an incidence screen in the matched-pair framework analysis that adjusts for period and carryover effects. (Refer to
Categorical Data Analysis Using SAS
for more information.)
1
In the Severity, Resolution, and
ANOVA
reports, treatment period is an additional
fixed effect
in the
mixed model
analysis (multiple repeated measures for subjects are already accounted for by the
random effect
component).