The
DM
Distribution
report compares
distributions
of demographic
variables
across treatment
arms
via a
one-way ANOVA
or contingency analysis.
Note
: This report cannot be run on machines running English-language operating systems if specified filters contain double-byte character sets (DBCS).
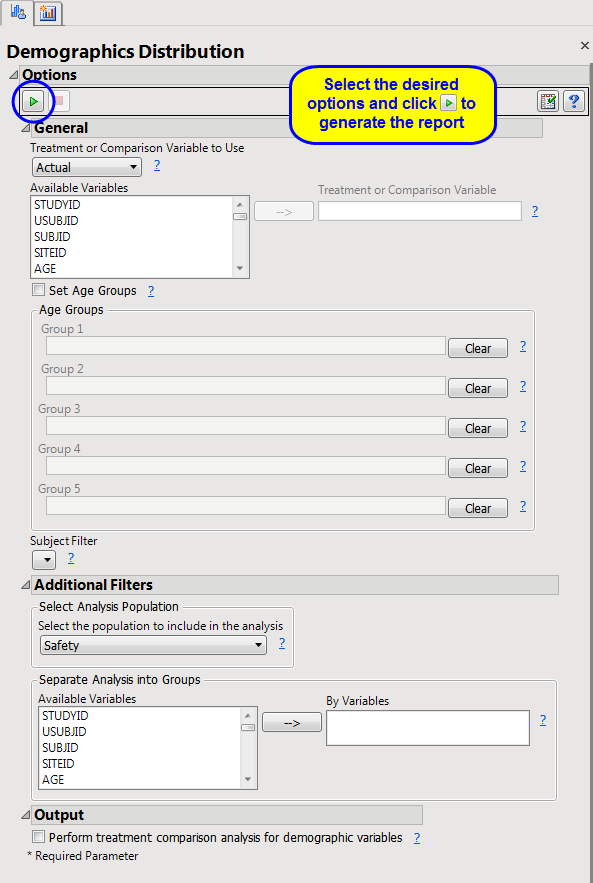
Running this report with the
Nicardipine
sample setting and default options generates the output shown below.
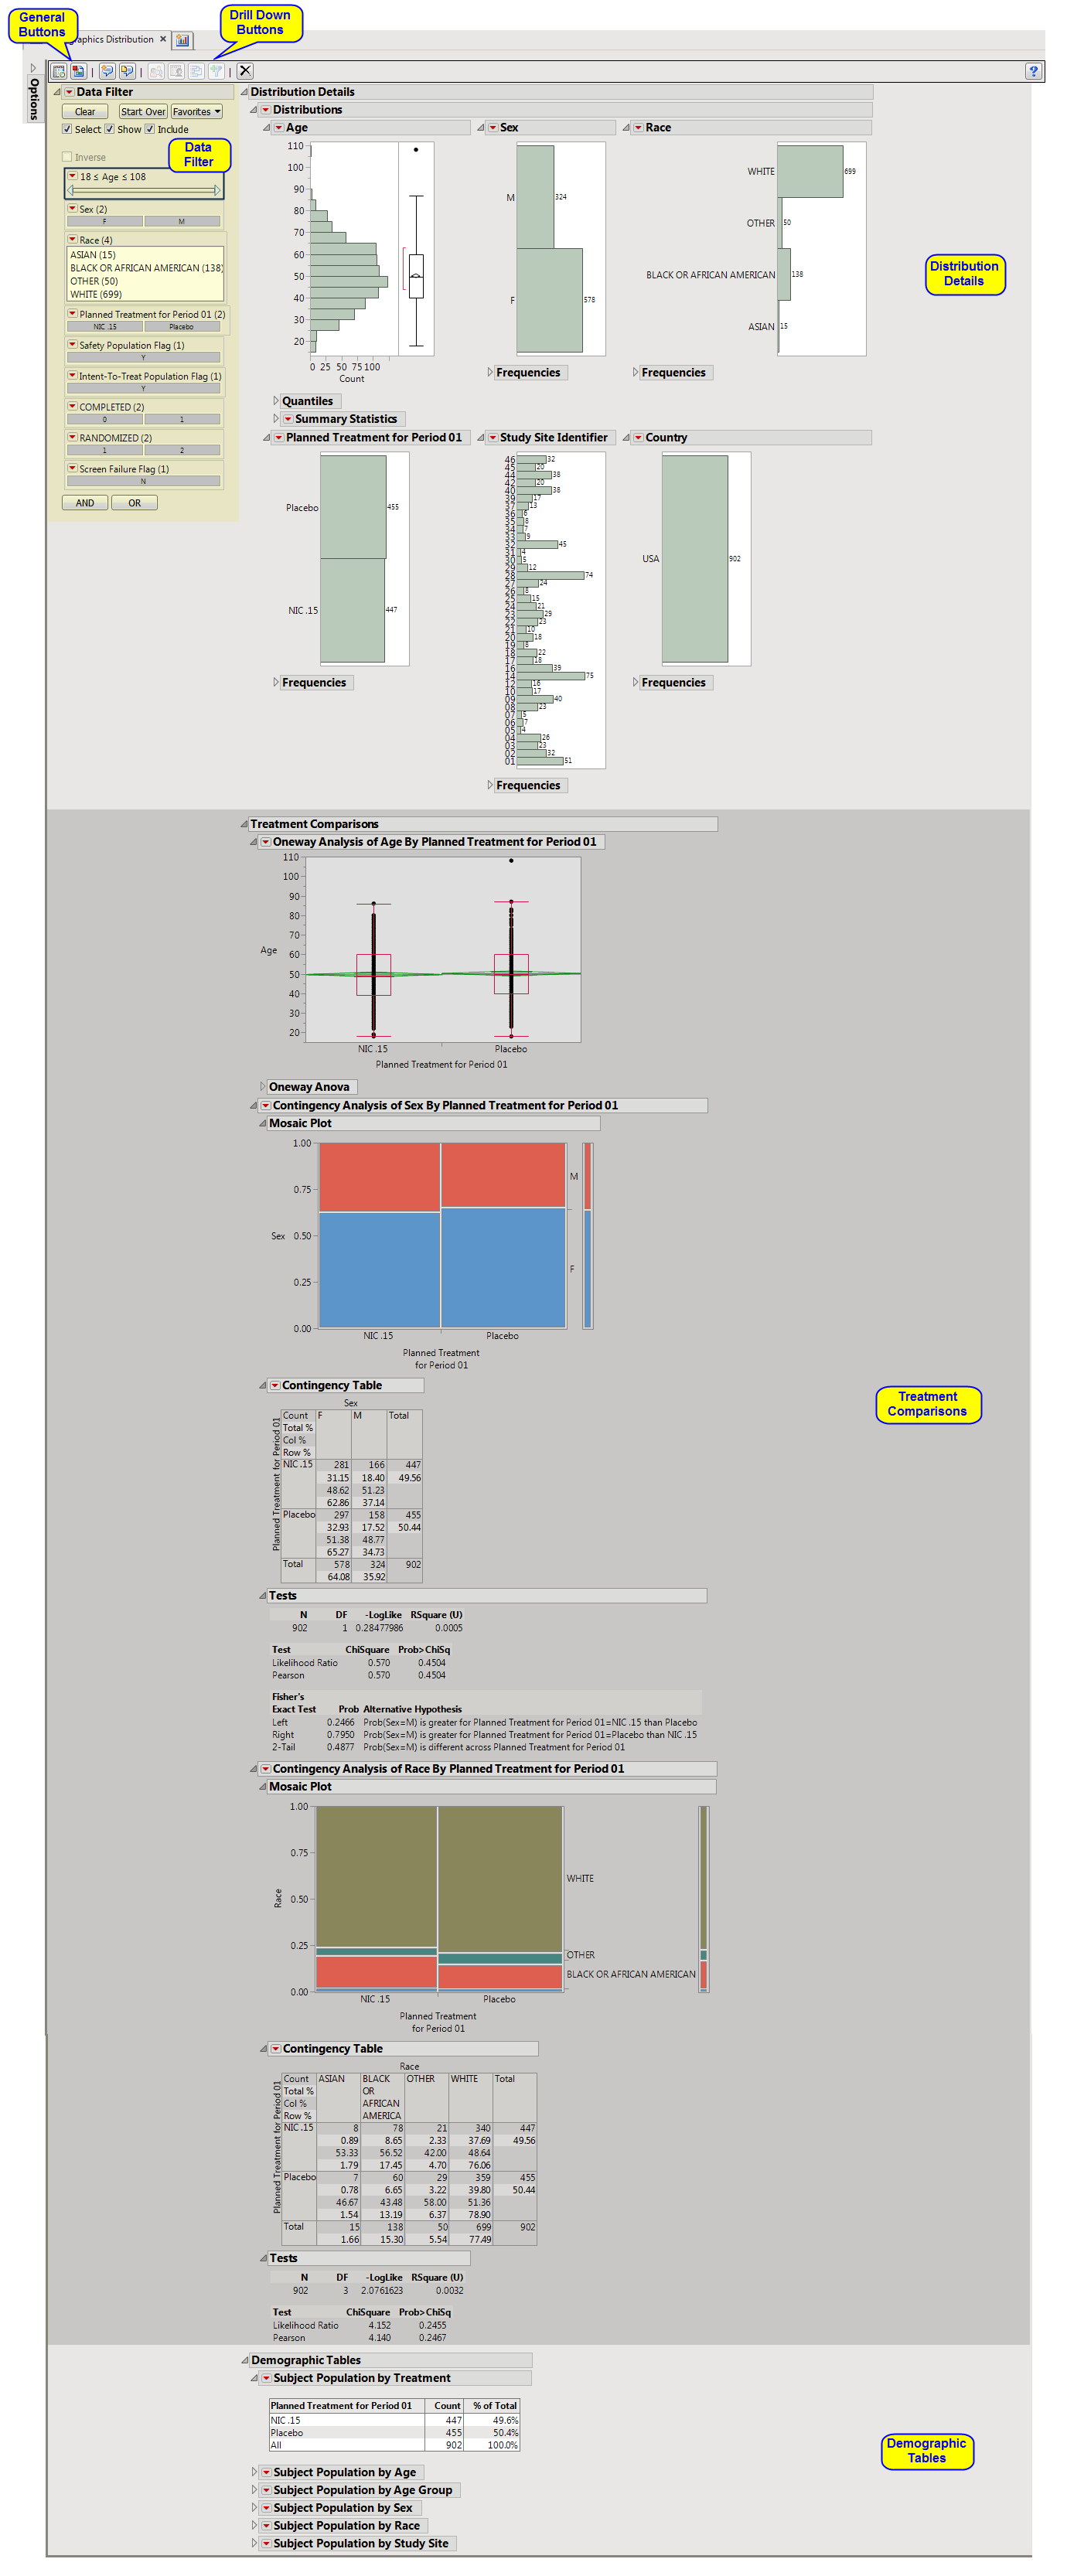
The
DM Distribution
report initially shows two sections
Distribution Details
and
Demographic Tables
. Use the available options in each section to drill-down into the data.
Presents histograms for available demographic characteristics such as age, treatment, sex, race, ethnicity. Histograms of the,
Study Site Identifier
and
Country
are also presented. Should more than one
Country
be presented in the
DM
domain, a world map is presented with color indicating the count of subjects from each
Country
. See JMP Documentation on Distribution for more information.
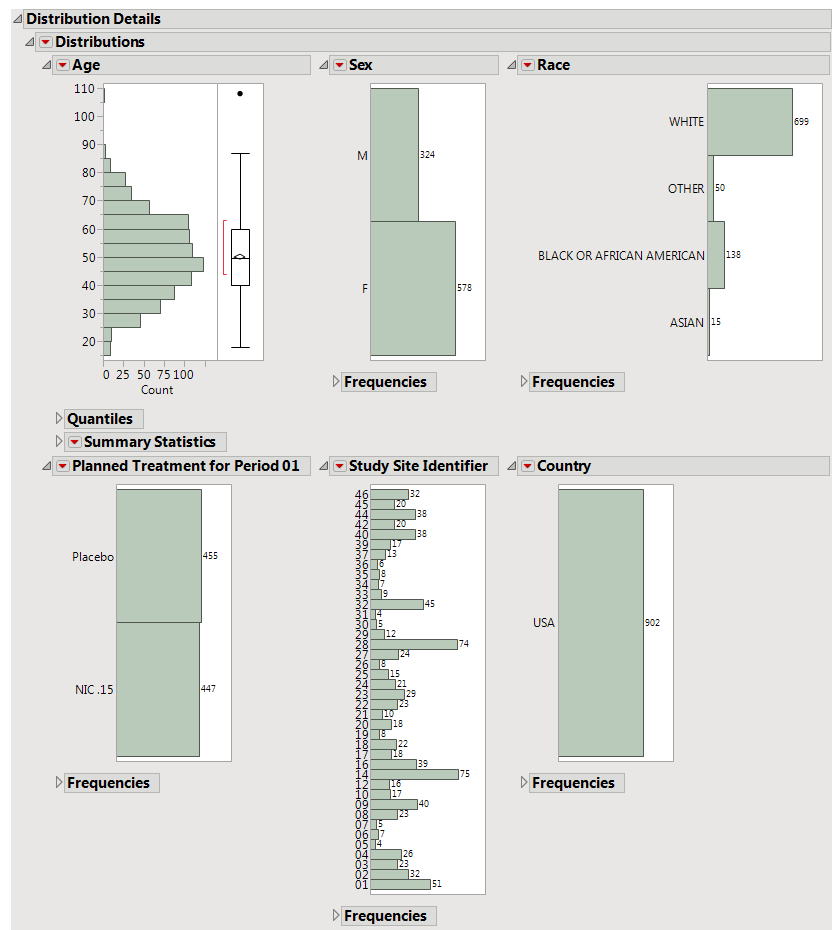
The
Distribution Details
section contains the following elements:
|
•
|
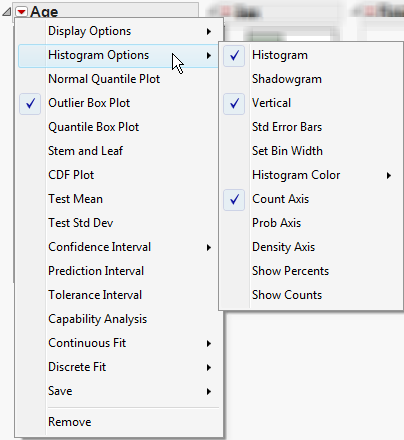
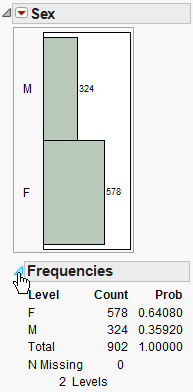
The height (or length) of each bar is an indication of the number of subjects exhibiting each demographic characteristic. Numbers above (or to the right of) each bar reflect a count of the number of subjects. Counts or percents can be added or removed using
Histogram Options
, which can be viewed by selecting the
red triangle
(
 ).
).
Quantiles
and summary statistics are provided for continuous
variables
like
Age
, and frequencies are provided for categorical variables like
Sex
. These can be viewed by clicking the
triangles
(
 ).
).
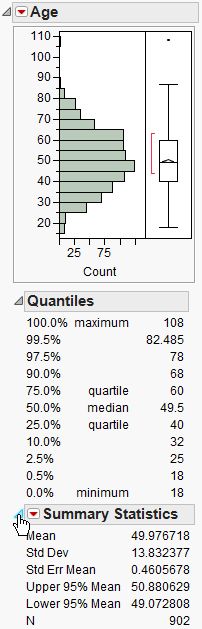
See
Distribution
for more information.
|
•
|
In lieu of a histogram, should
Country
have more than one level, a map summarizes the geographic location of individuals. Color is reflective of the number of subjects from each
Country
.
See
maps
for more information.
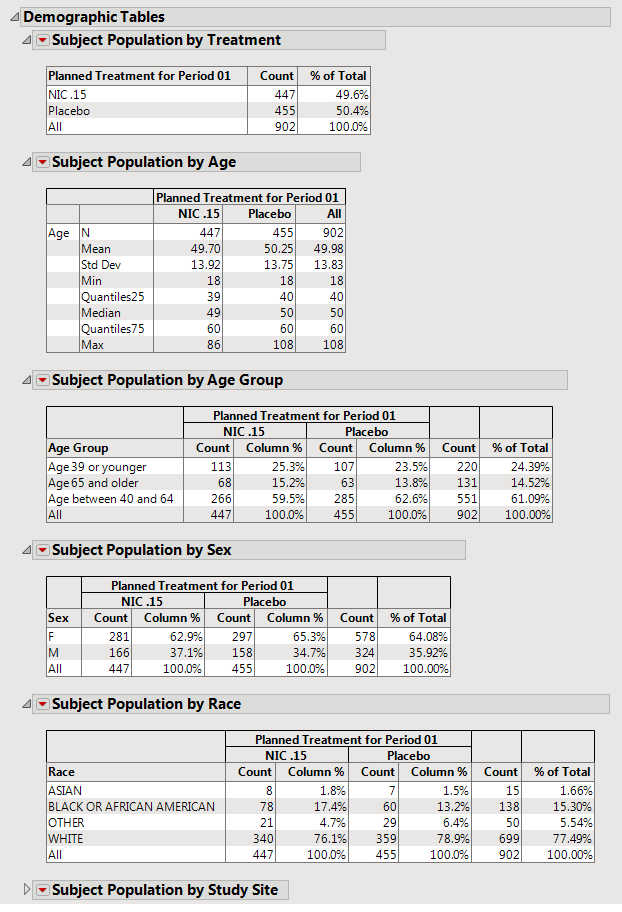
The
Demographic Tables
section contains the following elements:
|
•
|
Tables detailing the subject
population
by
Treatment
,
Age
,
Age Group
,
Sex
,
Race
, and
Study Site
.
|
Tip
: You can use the
Data Filter
found on the left side of the report to subset the tables on the
Demographic Tables
section based on subject demographic characteristics and treatment.
This enables you to subset subjects based on demographic characteristics and treatment. Refer to
Data Filter
for more information.
|
•
|
Profile Subjects
: Select subjects and click
|
|
•
|
Show Subjects
: Select subjects and click
|
|
•
|
Cluster Subjects
: Select subjects and click
|
|
•
|
Demographic Counts
: Select subjects and click
|
|
•
|
Click
|
|
•
|
Click
|
|
•
|
Click
|
|
•
|
Click
|
|
•
|
Click the
arrow to reopen the completed report dialog used to generate this output.
|
|
•
|
Click the gray border to the left of the
Options
tab to open a dynamic report navigator that lists all of the reports in the review. Refer to
Report Navigator
for more information.
|
Subject-specific filters must be created using the
Create Subject Filter
report prior to your analysis.