The
AE Time to Event
report screens all
adverse events
by performing log-rank and
Wilcoxon tests
between treatment groups. The time to first occurrence of the adverse event is used as the response.
Note
: If you run this analysis using data from a blinded study or from a study that has only one ARM, you generate a different set of output. See
AE Time to Event (One ARM)
for a detailed description
The
AE Time to Event
report screens all
adverse events
by performing log-rank and
Wilcoxon tests
between treatment groups. The time to first occurrence of the adverse event is used as the response.
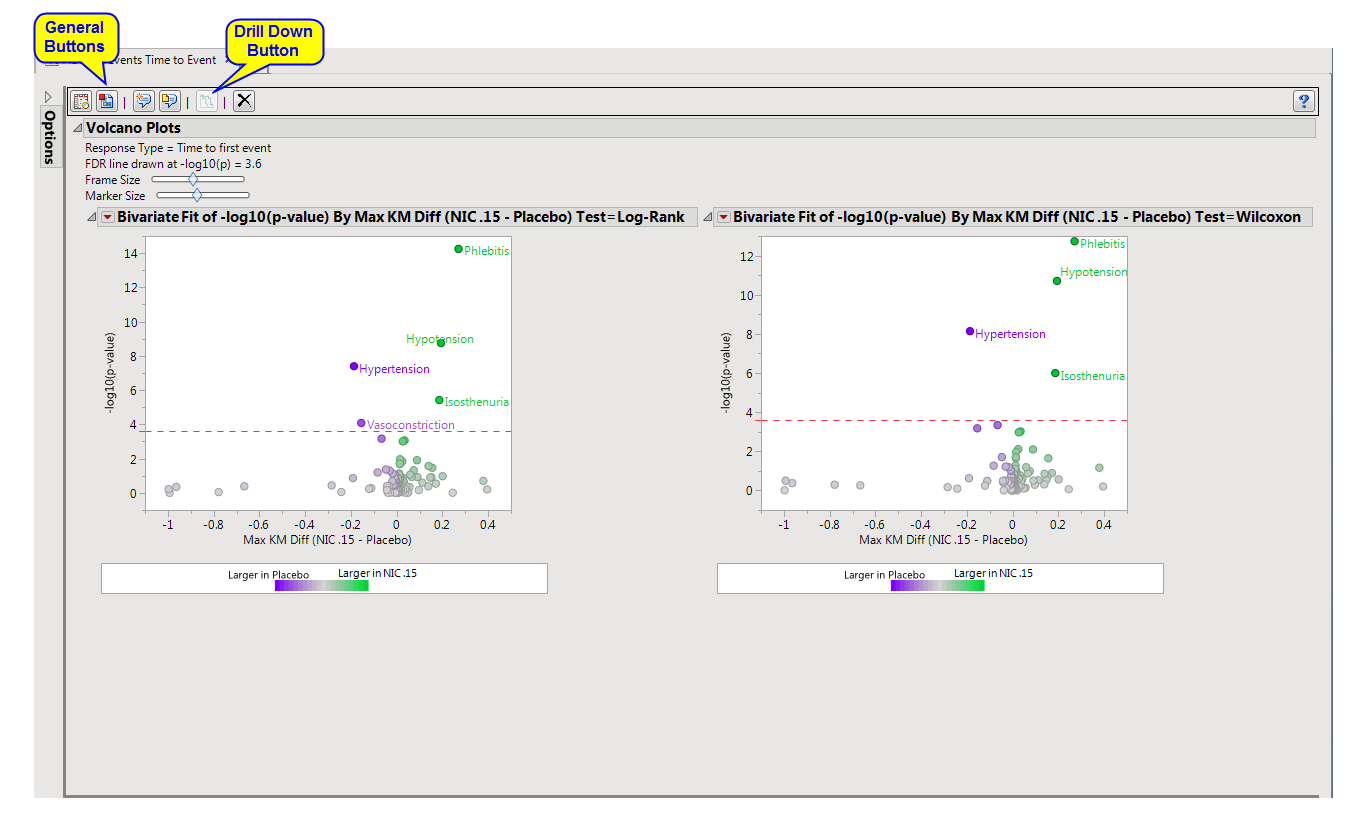
Presents summary figures for two popular statistical tests for
Kaplan-Meier
analyses: the
Log-Rank
and
Wilcoxon
.
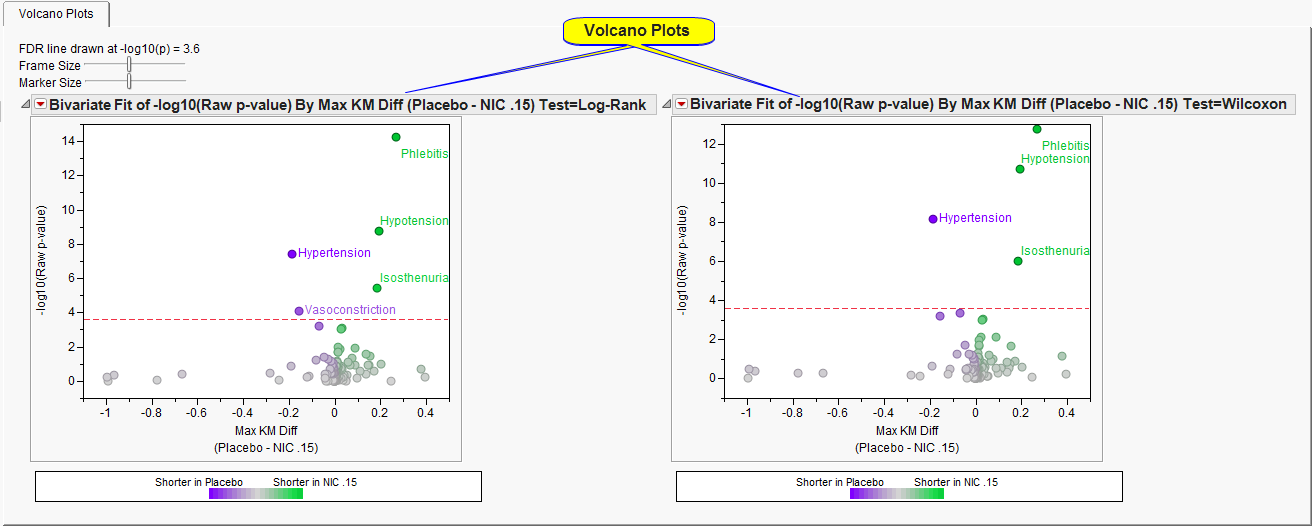
The
Volcano Plots
section contains the following elements:
|
•
|
Two
Volcano Plots
.
|
The
Y
axis represents the
-log
10
(raw
p-value
) from either the
Log-Rank test
(
left
) or the
Wilcoxon test
(
right
). In most instances, these two tests coincide. To interpret this axis, consider the following.
The
X
axis represents the maximum computed distance between the two curves, and
color
indicates which treatment was likely to have the event sooner. For example,
Phlebitis
occurs at approximately 0.27 on the
X
axis and is
green
. This means that at least one time point in the
Kaplan-Meier and Hazard Plots
, the risk of having this particular event was 27% more likely for Nicardipine versus Placebo.
Events above the
dotted red line
are considered statistically significant after adjusting for multiple comparisons. Adjustment is applied using the linear step-up method of Benjamini and Hochberg (1995) to control the false discovery rate.
See
Volcano Plot
for more information.
|
•
|
Kaplan-Meier and Hazard Plots
: Click
|
|
•
|
Fit Incidence Density Model
: Click
|
|
•
|
Click
|
|
•
|
Click
|
|
•
|
Click
|
|
•
|
Click
|
|
•
|
Click the
arrow to reopen the completed report dialog used to generate this output.
|
|
•
|
Click the gray border to the left of the
Options
tab to open a dynamic report navigator that lists all of the reports in the review. Refer to
Report Navigator
for more information.
|
Note
: For information about how treatment emergent adverse events (TEAEs) are defined in JMP Clinical, please refer to
How does JMP Clinical determine whether an Event Is a Treatment Emergent Adverse Event?
..
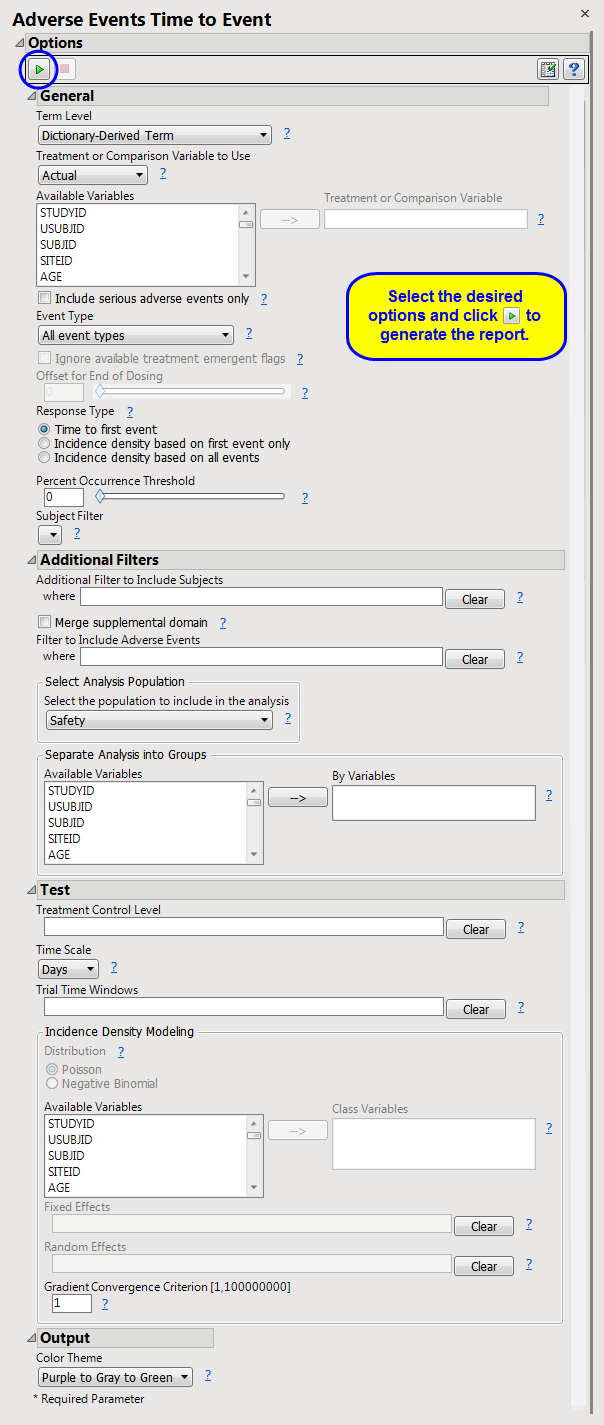
Include serious adverse events only
,
Event Type
,
Ignore available treatment emergent flags
,
Offset for End of Dosing
,
Response Type
,
Percent Occurrence Threshold
Additional Filter to Include Subjects
2
Merge supplemental domain
,
Filter to Include Adverse Events
,
Select the population to include in the analysis
,
By Variables
Incidence Density Modeling
:
Distribution
,
Class Variables
,
Fixed Effects
,
Random Effects
,
Gradient Convergence Criterion
Subject-specific filters must be created using the
Create Subject Filter
report prior to your analysis.
For more information about how to specify a filter using this option, see
The SAS WHERE Expression
.