The
Discontinuation Time to Event
report
plots the number of subjects still enrolled in the study versus days completed.
Running this report for
Nicardipine
using default settings generates the tabbed
Results
shown below.
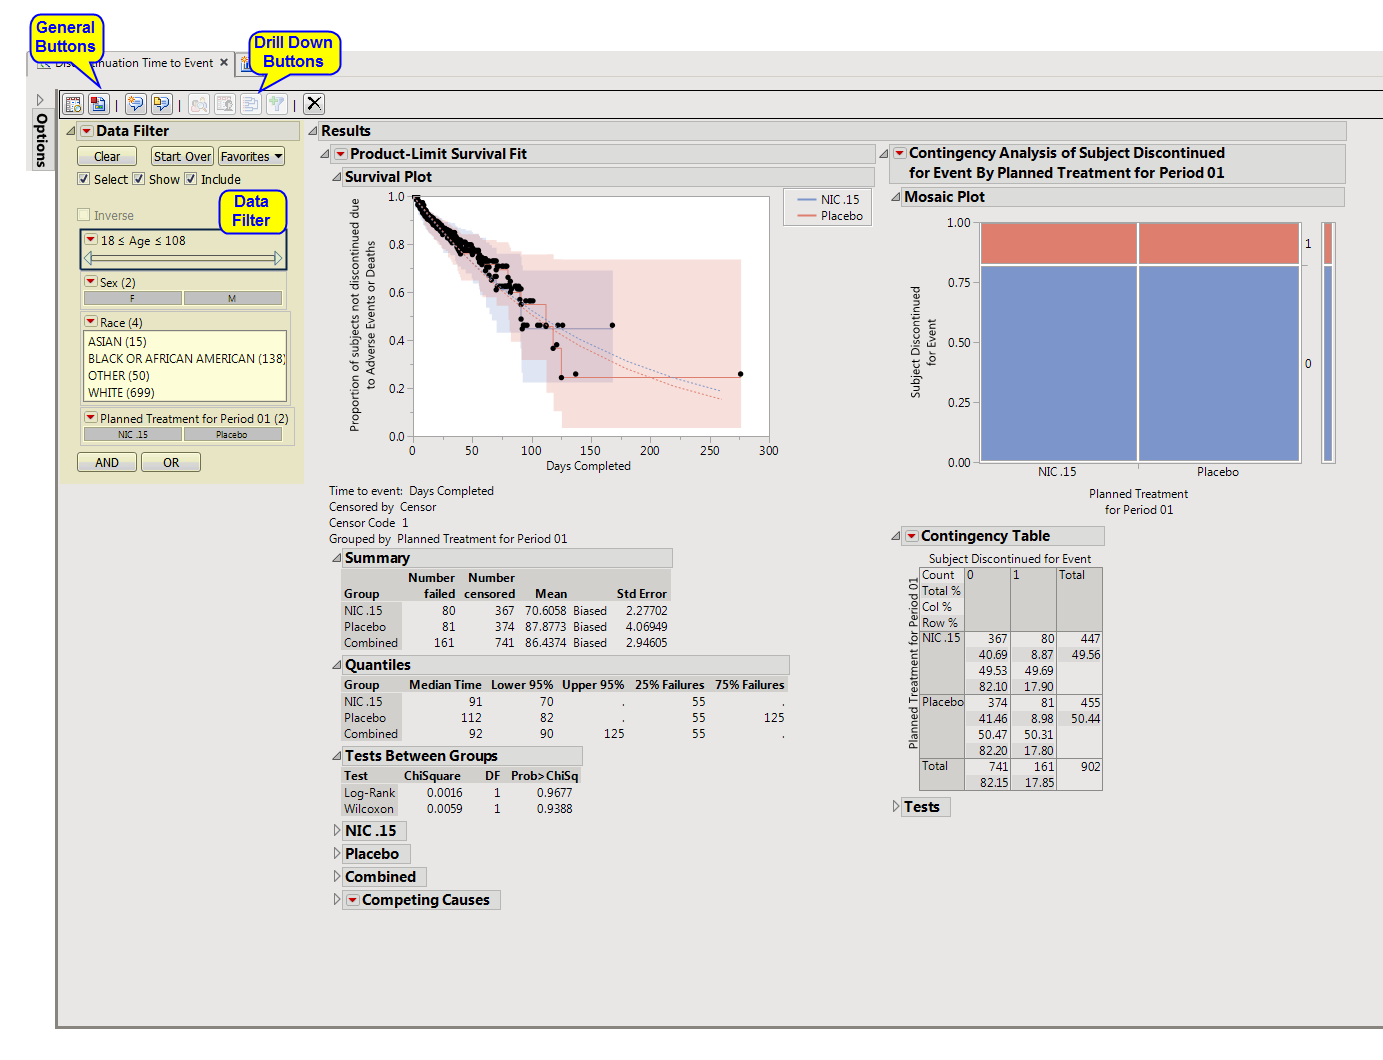
Enables you to subset subjects based on demographic characteristics and other criteria. Refer to
Data Filter
for more information.
Contains a
Kaplan-Meier
time-to-event analysis as well as a contingency analysis of treatment versus discontinuation status. You can define what constitutes a discontinuation using the
Define events as:
option in the
dialog
.
|
•
|
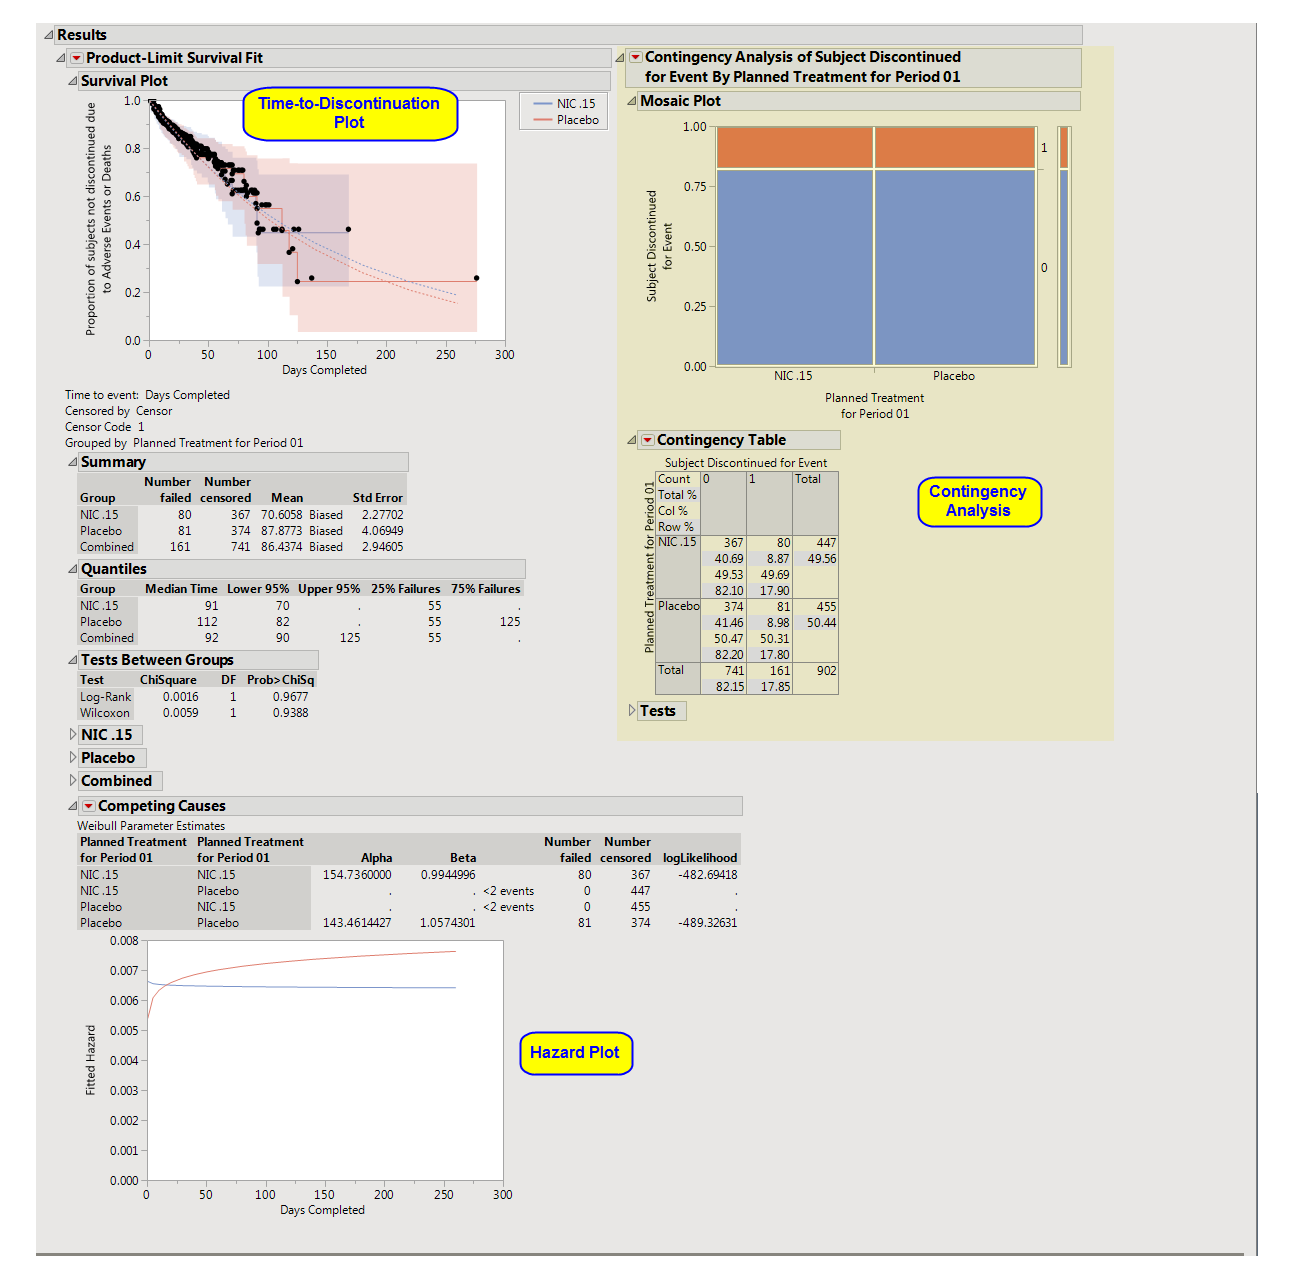
One
Time-to-Discontinuation Plot
.
|
This analysis compares the time until discontinuation of individuals in the study. Otherwise, subjects are
censored
when they complete the trial.
See
Survival Plot
for more information.
|
•
|
Compares treatment versus discontinuation status. This analysis
ignores
the time at which discontinuations occur.
See
Contingency Table
for more information.
|
•
|
One
Hazard Plot
|
The
Competing Causes
section of the includes a Weibull fit and corresponding hazard plot showing treatment emergent
adverse event
risk over time.
|
•
|
Profile Subjects
: Select subjects and click
|
|
•
|
Show Subjects
: Select subjects and click
|
|
•
|
Cluster Subjects
: Select subjects and click
|
|
•
|
Demographic Counts
: Select subjects and click
|
|
•
|
Click
|
|
•
|
Click
|
|
•
|
Click
|
|
•
|
Click
|
|
•
|
Click the
arrow to reopen the completed dialog used to generate this output.
|
|
•
|
Click the gray border to the left of the
Options
tab to open a dynamic report navigator that lists all of the reports in the review. Refer to
Report Navigator
for more information.
|

Additional Filter to Include Subjects
2
Merge supplemental domain
,
Select the population to include in the analysis
,
By Variables
Incidence Density Modeling
:
Distribution
,
Class Variables
,
Fixed Effects
,
Random Effects
,
Gradient Convergence Criterion
Subject-specific filters must be created using the
Create Subject Filter
report prior to your analysis.
For more information about how to specify a filter using this option, see
The SAS WHERE Expression
.