Note
: JMP Clinical uses a special protocol for data including non-unique Findings test names. Refer to
How does JMP Clinical handle non-unique Findings test names?
for more information.
Running this report with the
Nicardipine
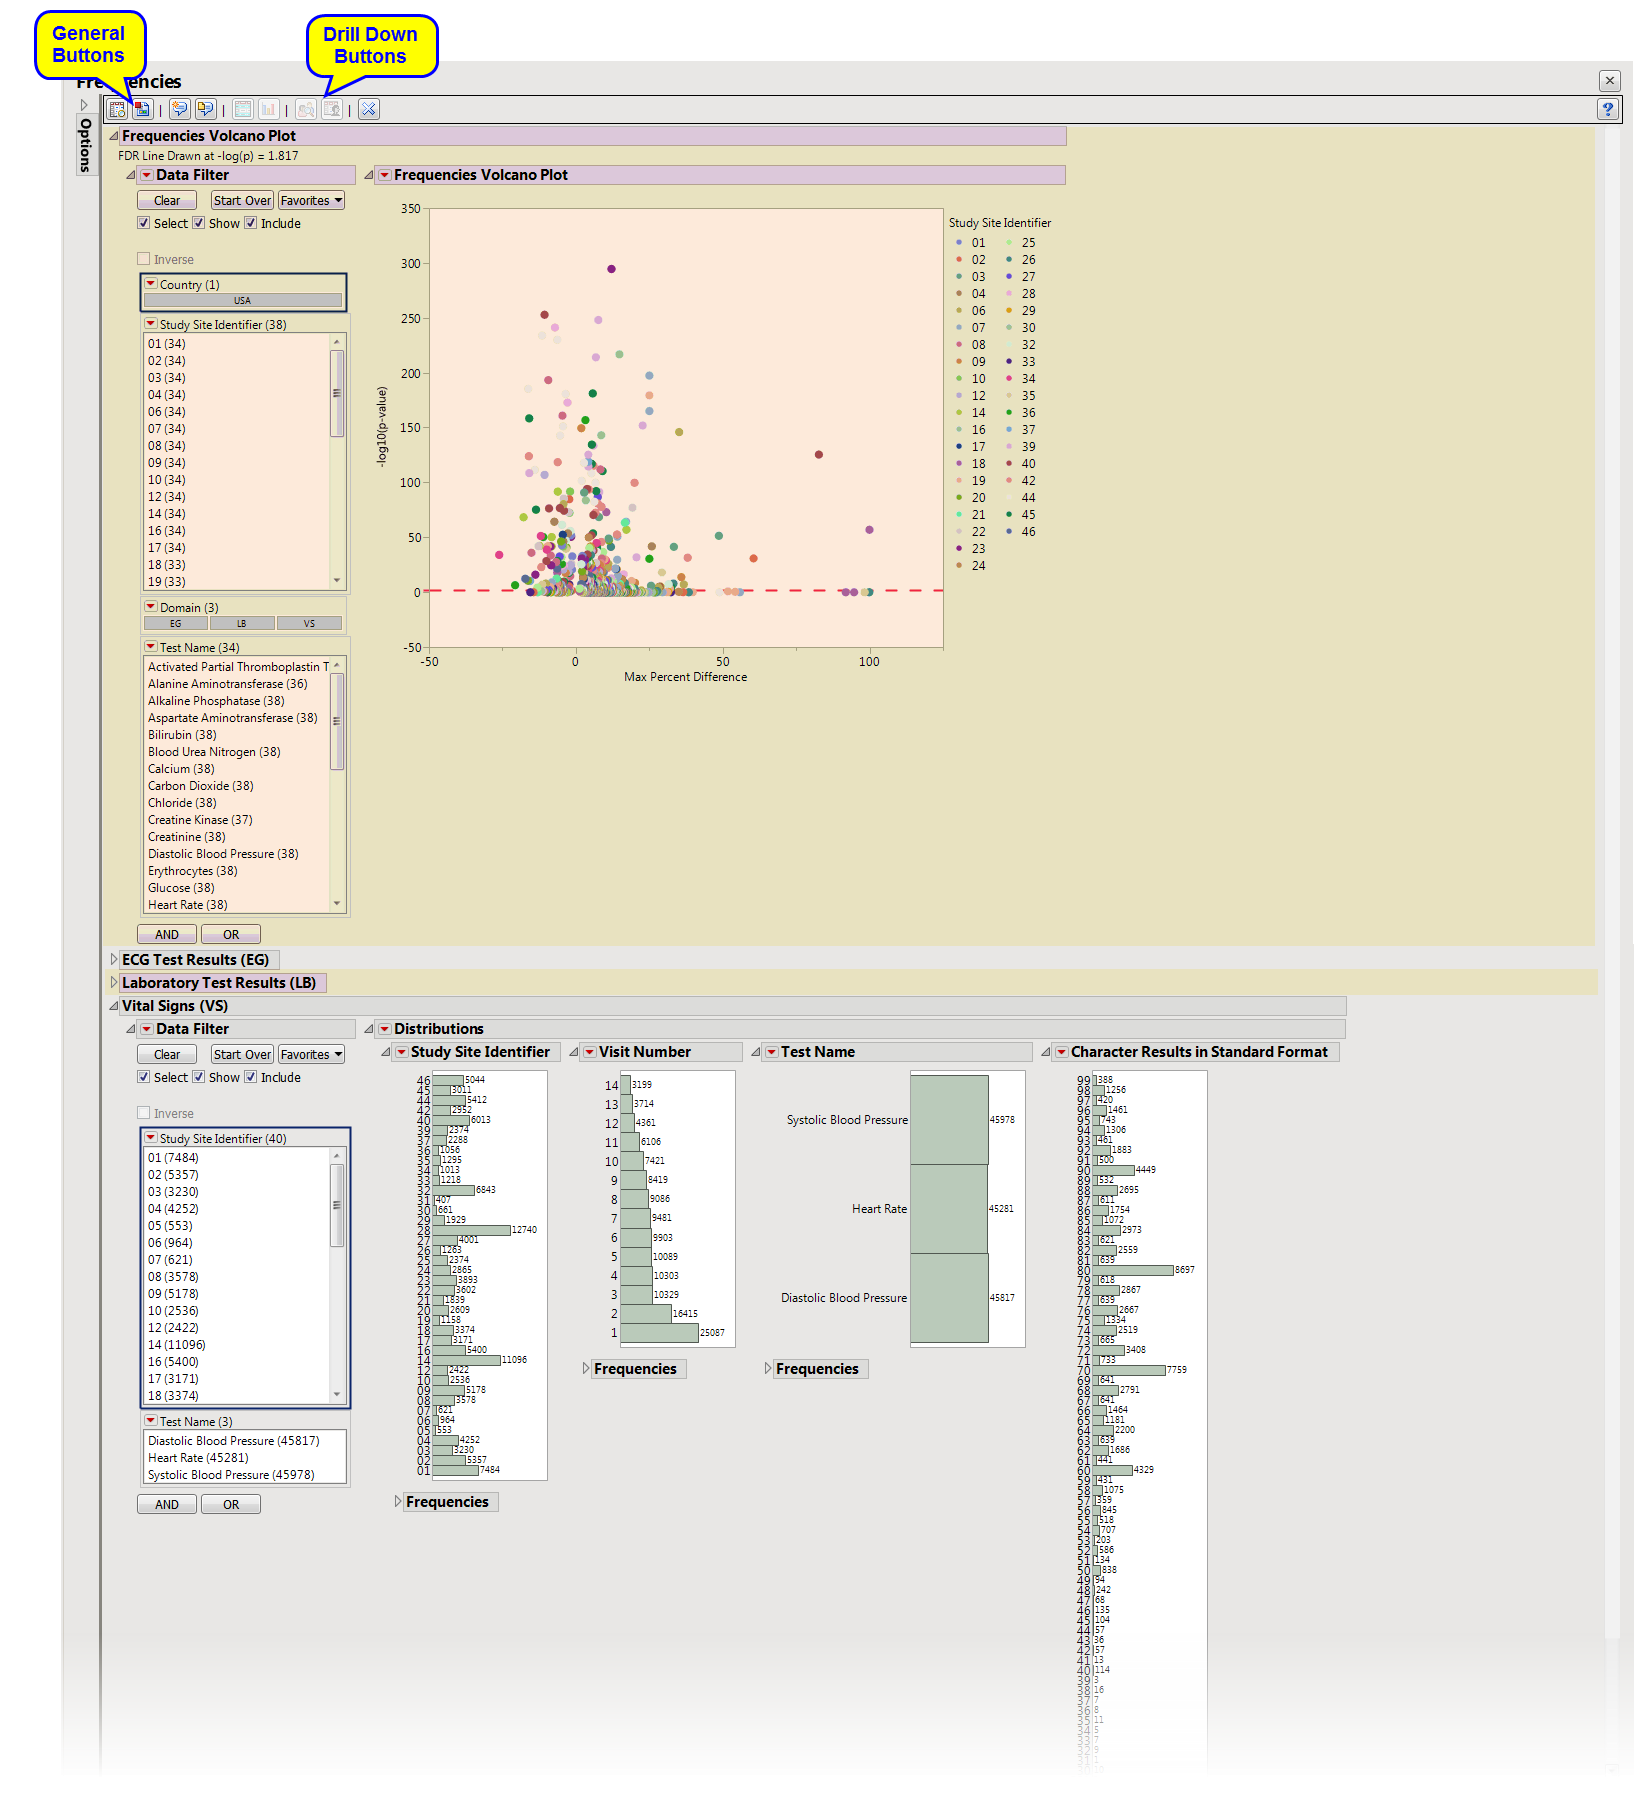
sample setting generates the report shown below.
The
Report
contains the following elements:
|
•
|
One
Data Filter
.
|
Enables you to subset subjects based on country of origin, study site and/or Test. Refer to
Data Filter
for more information.
|
•
|
The volcano plot is used to determine the deviation of the proportion of findings frequencies at each site with the overall proportions for the findings across the whole study. Each “bubble” represents a single Findings test for a specific site, which is compared to a reference (all other sites).The
X
axis represents the maximum difference in proportions between each value of the Findings test between the site and the reference set (all other sites).
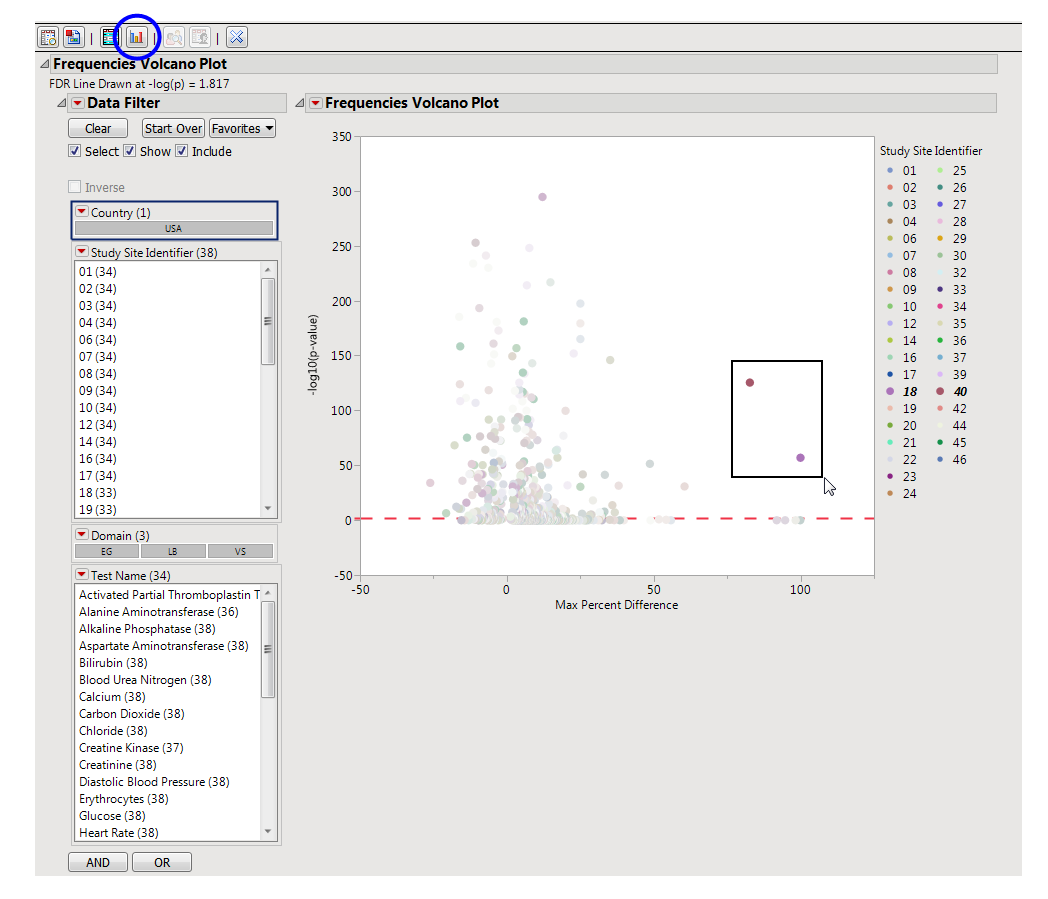
You can mouse over points of interest to see their labels or select points by dragging a mouse rectangle over them (as shown above). Selected rows are highlighted in other plots and you can also then click on various
Down Buttons
for further analyses on those specific sites. For example, if you click
 , the following opens with comparisons of sites 18 and 40 with all sites not site 18 or 40, respectively.
|
•
|
Data Filter
: Enables you to filter data based on study site and country.
|
|
•
|
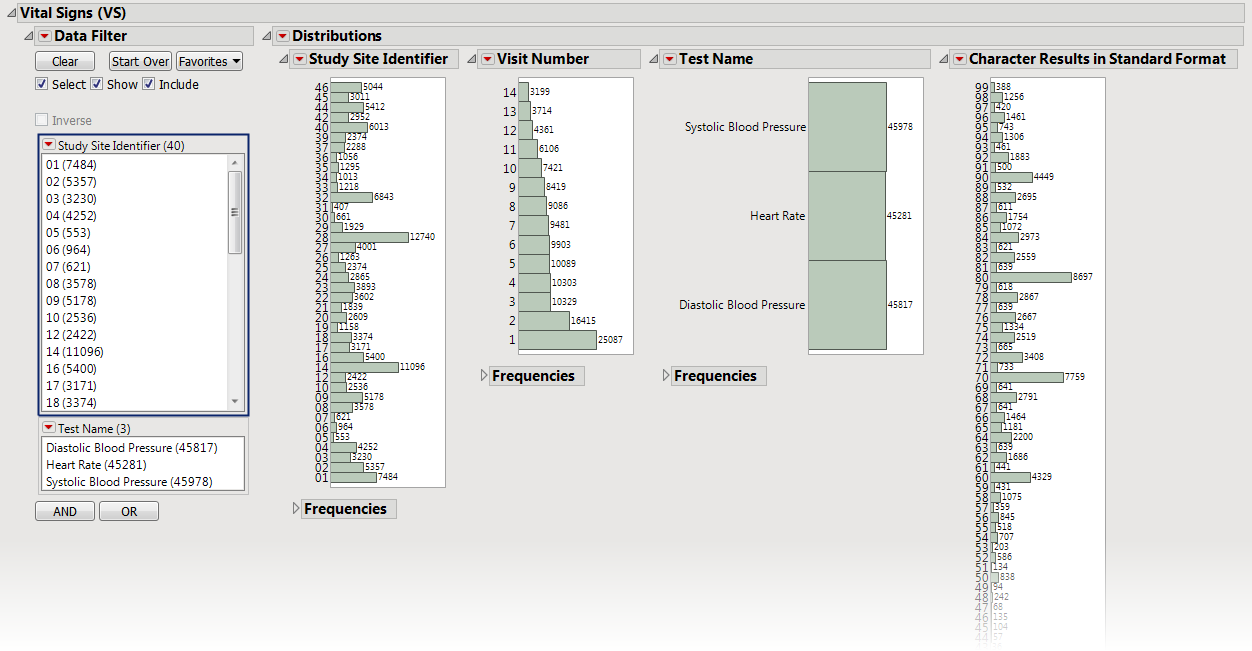
Distributions
: Displays histograms showing distribution of ECG findings across study sites, tests, and visit numbers, study sites, categories, and tests.
|
|
•
|
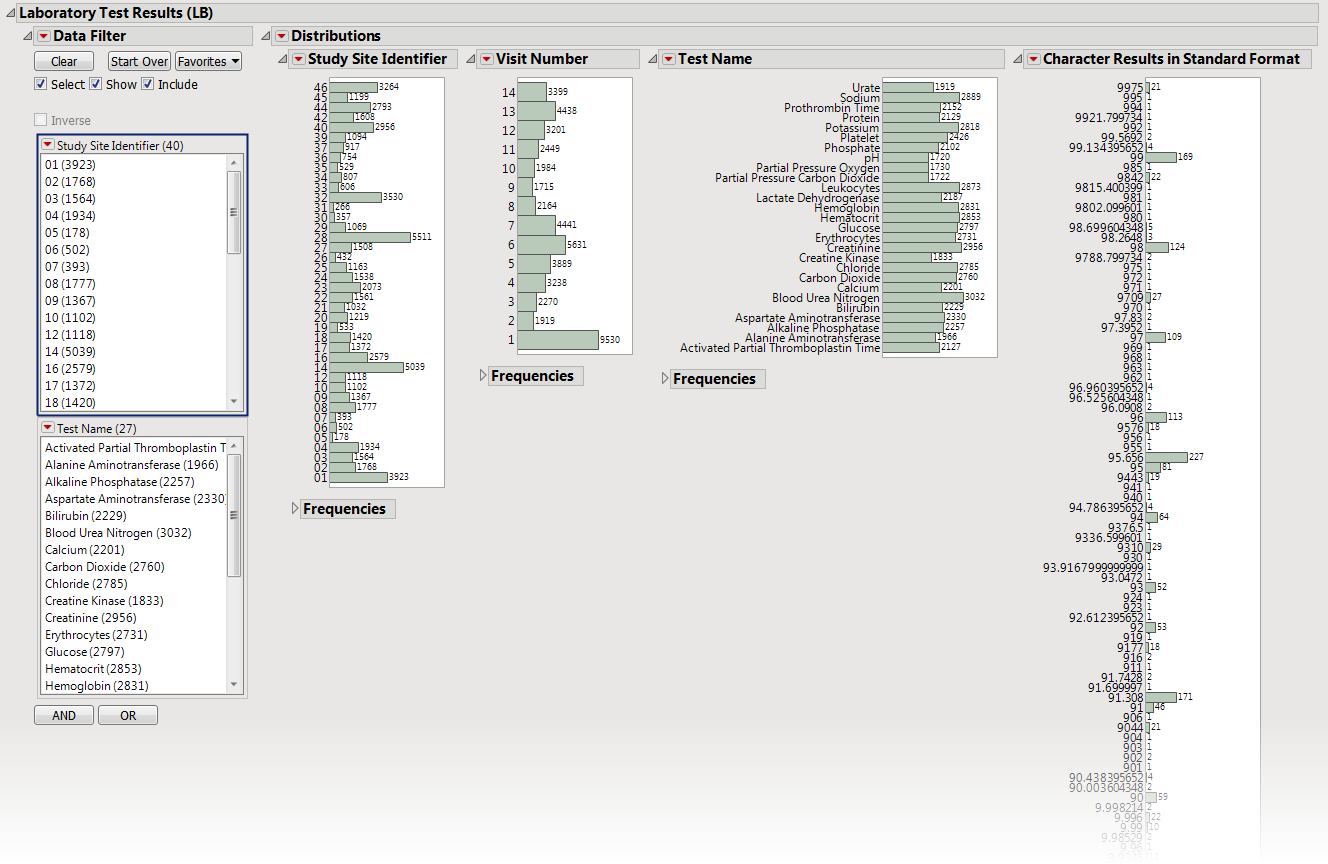
Data Filter
: Enables you to filter data based on study site and country.
|
|
•
|
Distributions
: Displays histograms showing distributions of laboratory test findings across study sites, tests, and visit numbers, and tests.
|
|
•
|
Data Filter
: Enables you to filter data based on study site and country.
|
|
•
|
Distributions
: Displays histograms showing distribution of vital signs findings across study sites, tests, and visit numbers,
|
|
•
|
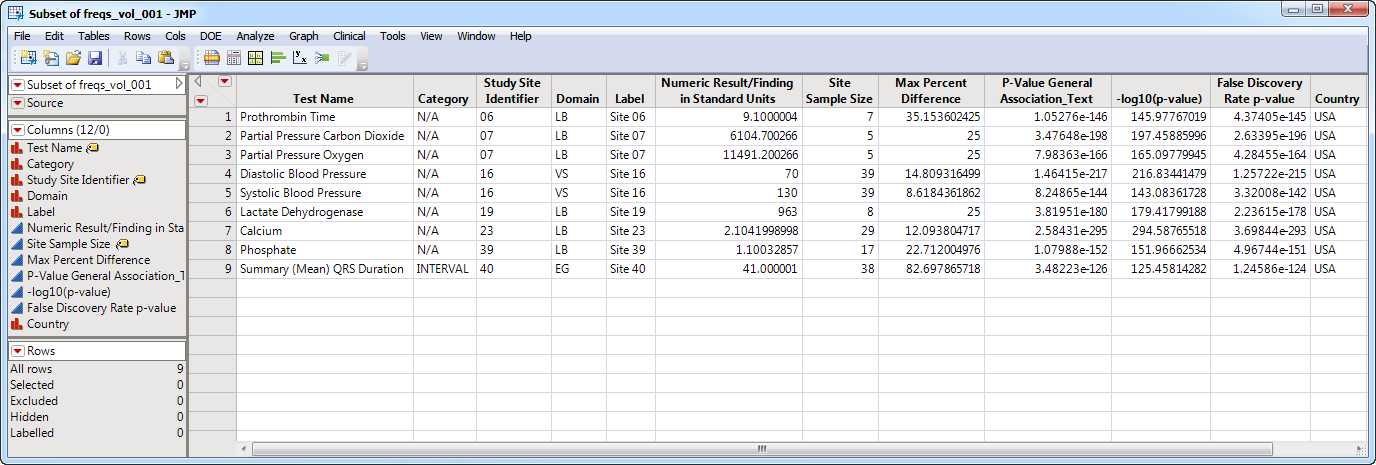
Show Sites
: Shows the rows of the data table for the selected points from the
volcano plot
. Clicking
|

|
•
|
Frequency Bar Chart
: Select points on the volcano plot and click
|
|
•
|
Profile Subjects
: Select subjects and click
|
|
•
|
Show Subjects
: Select subjects and click
|
|
•
|
Click
|
|
•
|
Click
|
|
•
|
Click
|
|
•
|
Click
|
|
•
|
Click the
arrow to reopen the completed report dialog used to generate this output.
|
|
•
|
Click the gray border to the left of the
Options
tab to open a dynamic report navigator that lists all of the reports in the review. Refer to
Report Navigator
for more information.
|
This report compares the observed distribution of categorical tests with each site compared to all other sites taken together as a reference, ordering by numeric equivalent if available. For example, if character variable lists none, mild moderate, severe, very severe with corresponding numeric value (
xxSTRESN
) listed as 0, 1, 2, 3, 4, the intended order of the column variable levels are maintained.
|
l
1
|
l
2
|
l
J
|
||
FDR
p
-values are calculated and the reference line is determined as described in
How does JMP Clinical calculate the False Discovery Rate (FDR)?
.
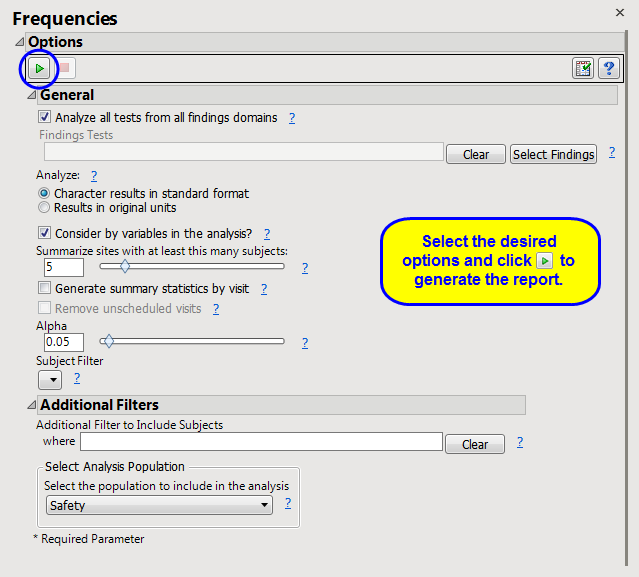
Analyze all tests from all findings domains
,
Findings Tests
,
Analyze:
,
Consider BY variables in the analysis
Summarize sites with at least this many subjects:
,
Generate summary statistics by visit
,
Remove unscheduled visits
Subject-specific filters must be created using the
Create Subject Filter
report prior to your analysis.
For more information about how to specify a filter using this option, see
The SAS WHERE Expression
.