Note
: JMP Clinical uses a special protocol for data including non-unique Findings test names. Refer to
How does JMP Clinical handle non-unique Findings test names?
for more information.
Running this report with the
Nicardipine
sample setting generates the report shown below.
The
Report
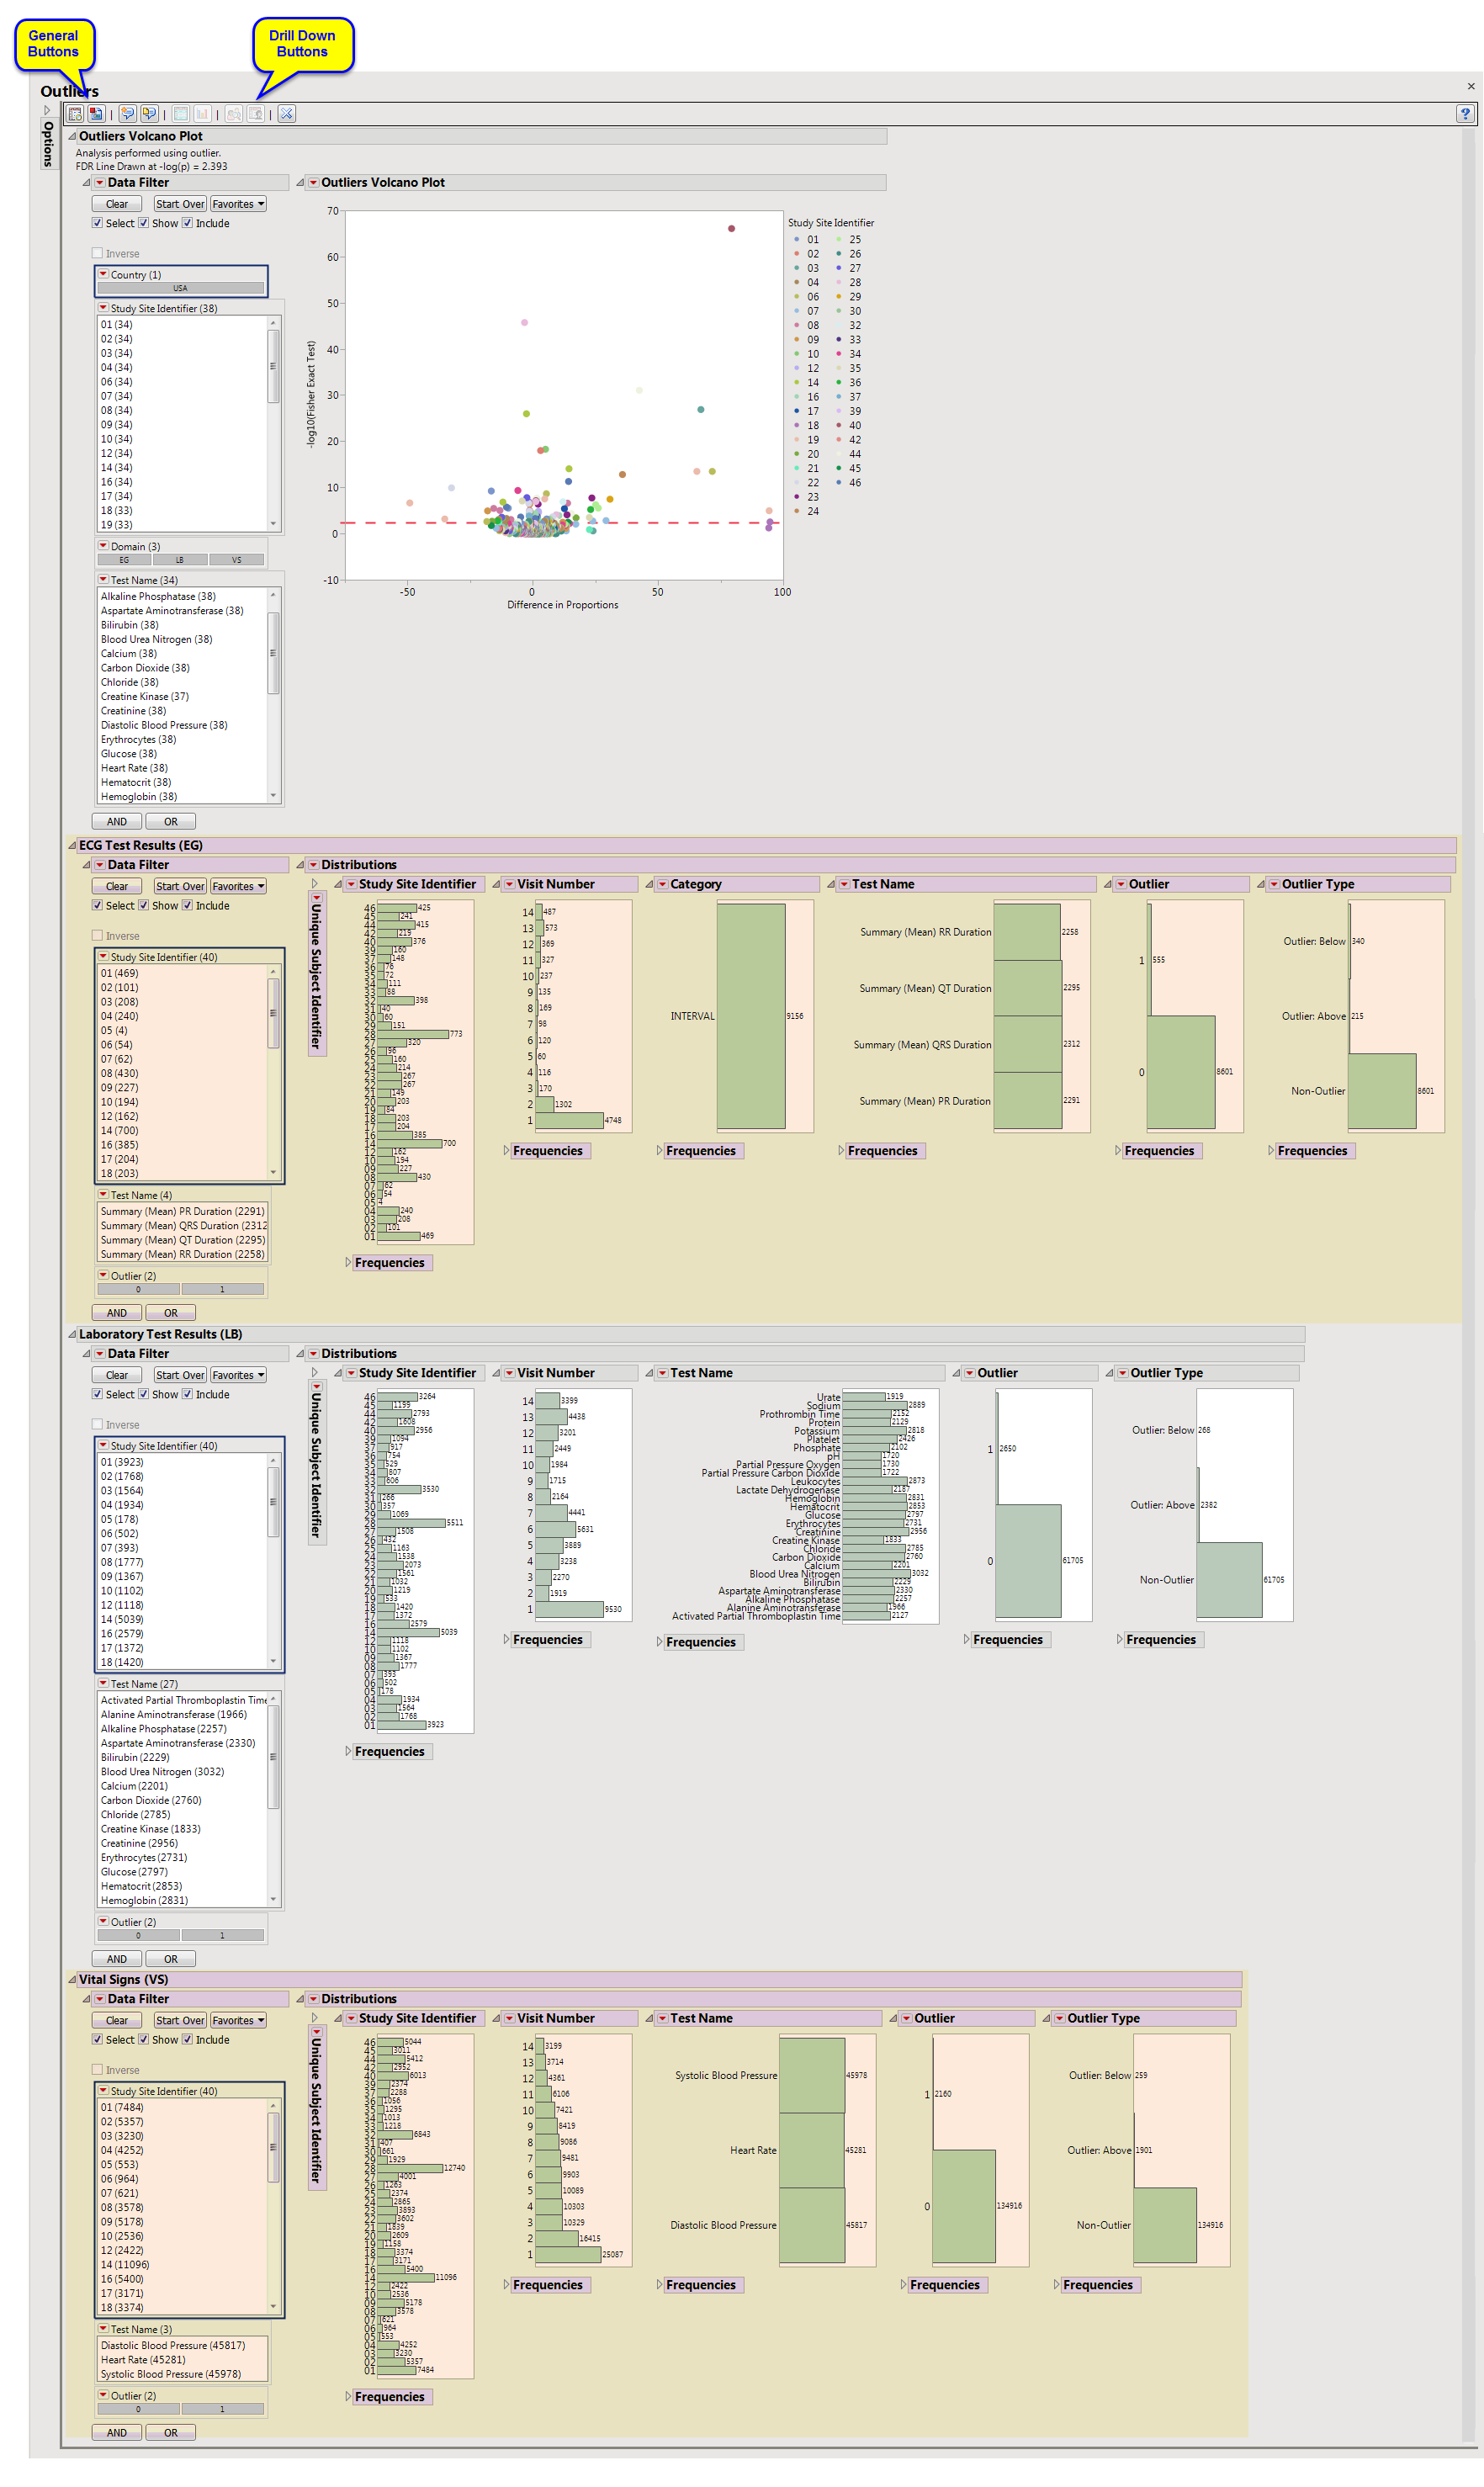
contains the following elements:
Shows a volcano plot used to determine the deviation of the proportion of outliers at each study site with the overall proportions for the whole study. The
X
axis is calculated using
p(site) - p(reference)
, where
p(site)
is the proportion (or percent) of outliers in the site in question and
p(reference)
is the proportion of outliers in all other sites.
|
•
|
One
Data Filter
.
|
Enables you to subset subjects based on country of origin, study site and/or Test. Refer to
Data Filter
for more information.
|
•
|
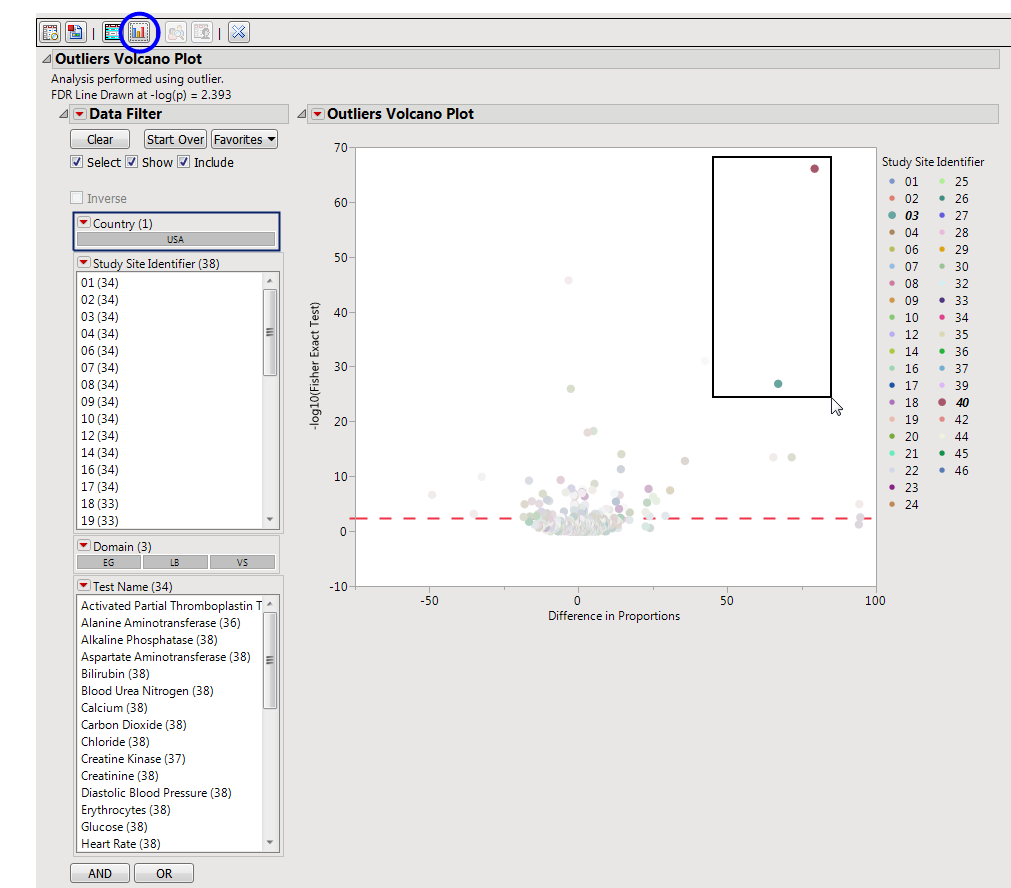
The volcano plot is used to determine the deviation in the proportion of outliers at each site from the proportion of outliers at all of the other sites. The
X
axis represents the difference in proportions for measurements that are considered outliers between the site and the reference set (all other sites).in the proportion of outliers at each site from the average proportion at all of the other sites.
You can mouse over points of interest to see their labels or select points by dragging a mouse rectangle over them (as shown above). Selected rows are highlighted in other plots and you can also then click on various
Down Buttons
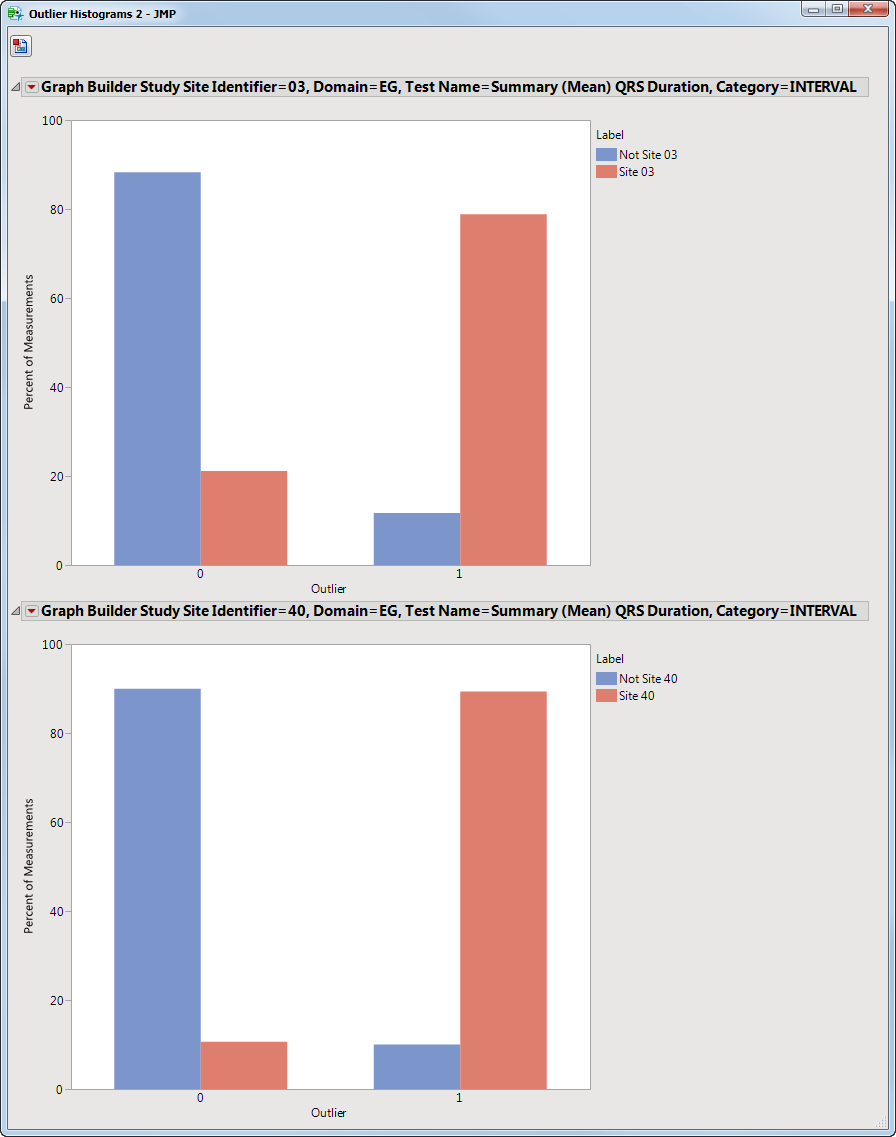
for further analyses on those specific sites. For example, if you click the
Outlier Bar Charts
(
 ) down, the following opens with comparisons of sites 3 and 40 with all sites not site 3 or 40, respectively.
|
•
|
Data Filter
: Enables you to filter data based on study site and country.
|
|
•
|
Distributions
: Displays histograms showing distribution of ECG findings across study sites, tests, and visit numbers, study sites, categories and tests. The last two histograms show the relative proportion of outliers and whether they are outliers because the value is too high (Outlier: Above) or small (Outlier: Below). Clicking Show Subjects will open a data table that will show the range of non-outlier values (Lower and Upper Outlier Limits).
|
|
•
|
Data Filter
: Enables you to filter data based on study site and country.
|
|
•
|
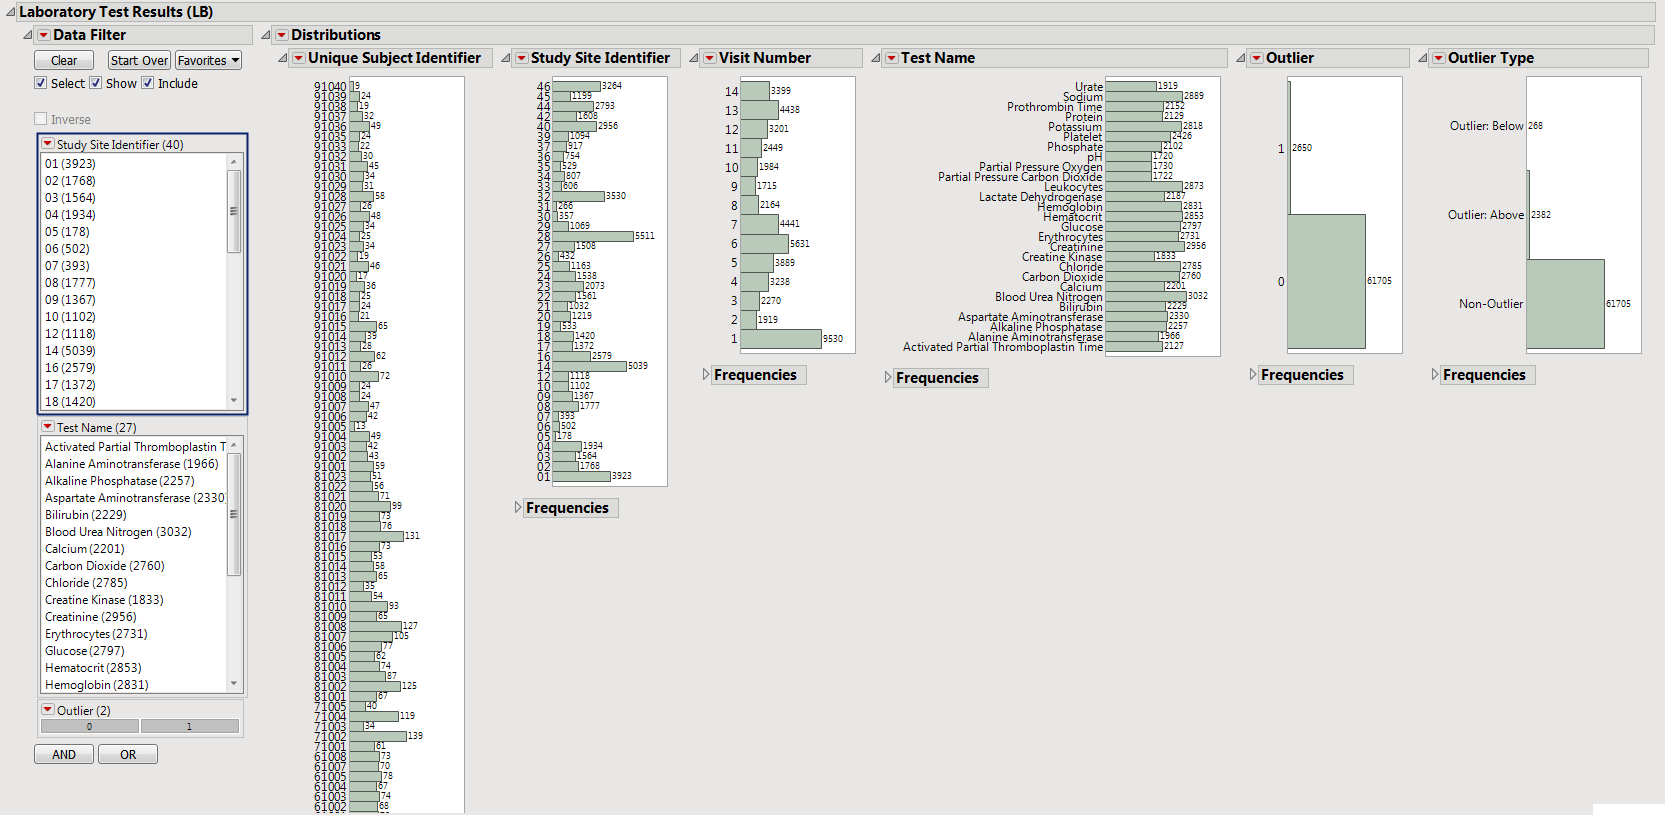
Distributions
: Displays histograms showing distribution of LB findings across study sites, tests, and visit numbers, study sites, categories, and tests. The last two histograms show the relative proportion of outliers and whether are outliers because the value is too high (Outlier: Above) or small (Outlier: Below). Clicking Show Subjects will open a data table that will show the range of non-outlier values (Lower and Upper Outlier Limits).
|
|
•
|
Data Filter
: Enables you to filter data based on study site and country.
|
|
•
|
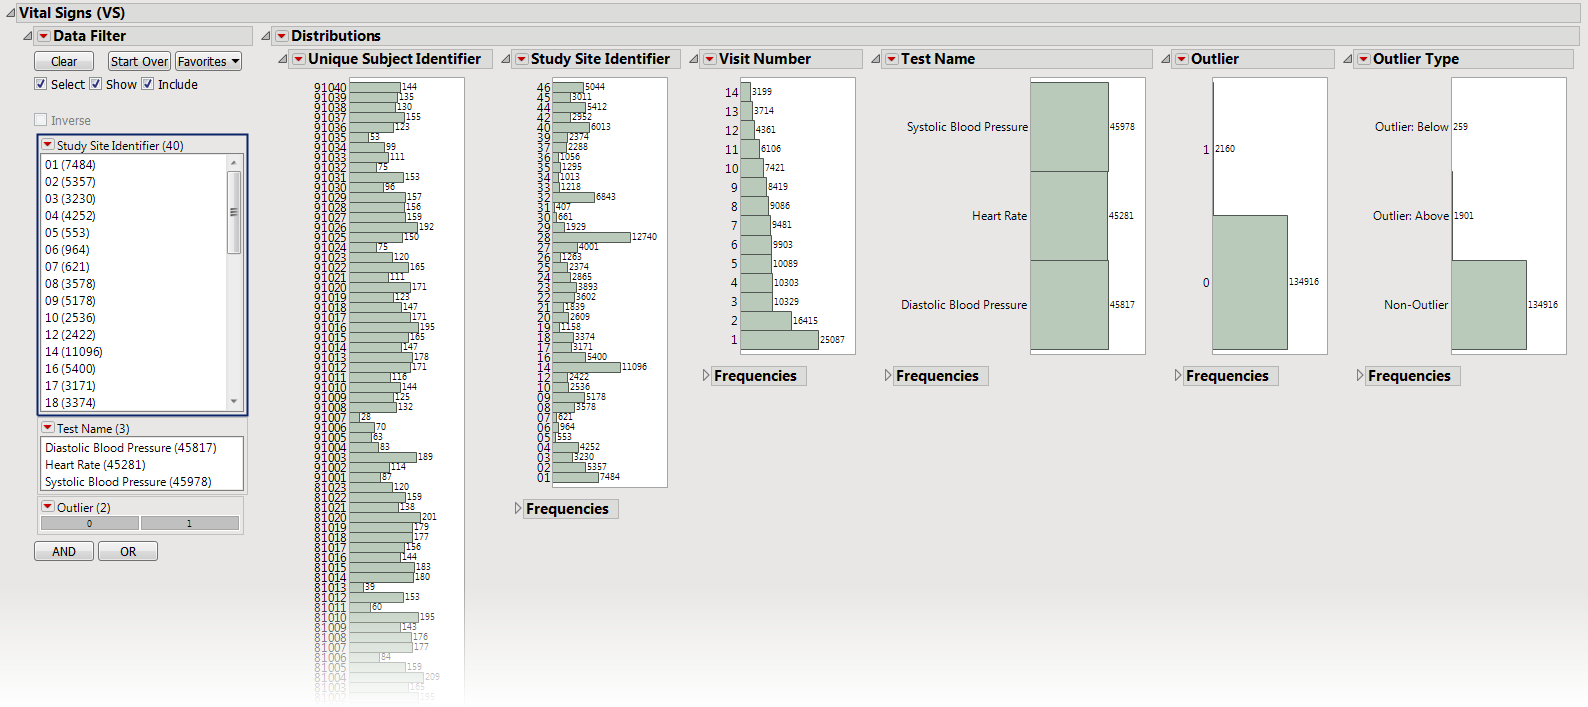
Distributions
: Displays histograms showing distribution of VS findings across study sites, tests, and visit numbers, study sites, categories, and tests. The last two histograms show the relative proportion of outliers and whether are outliers because the value is too high (Outlier: Above) or small (Outlier: Below). Clicking Show Subjects will open a data table that will show the range of non-outlier values (Lower and Upper Outlier Limits).
|
|
•
|
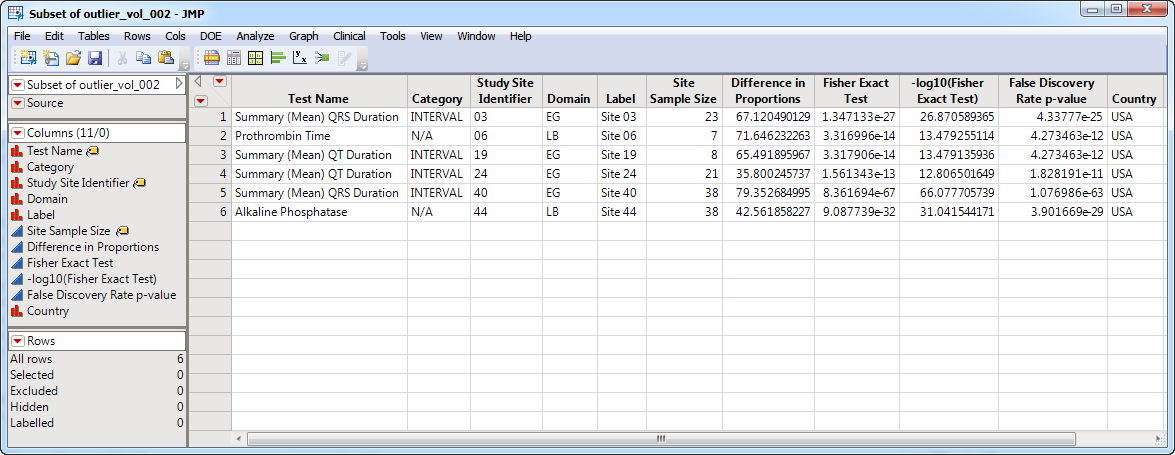
Show Sites
: Shows the rows of the data table for the selected points from the
volcano plot
. Clicking
|

|
•
|
Frequencies Bar Charts
: Select points on the volcano plot and click
|
|
•
|
Profile Subjects
: Select subjects and click
|
|
•
|
Show Subjects
: Select subjects and click
|
|
•
|
Click
|
|
•
|
Click
|
|
•
|
Click
|
|
•
|
Click
|
|
•
|
Click the
arrow to reopen the completed report dialog used to generate this output.
|
|
•
|
Click the gray border to the left of the
Options
tab to open a dynamic report navigator that lists all of the reports in the review. Refer to
Report Navigator
for more information.
|
This report compares the outlier status of tests with each site compared to all other sites taken together as a reference. A point is an outlier if it exceeds the upper outlier limit (
Q3+1.5×IQR
) or is less than the lower outlier limit (
Q1-1.5×IQR
), where
Q1
and
Q3
are first and third quartiles and
IQR =Q3-Q1
. It then compares the rate of outliers using Fisher's exact test. FDR
p
-values are calculated and the reference line is determined as described in
How does JMP Clinical calculate the False Discovery Rate (FDR)?
.
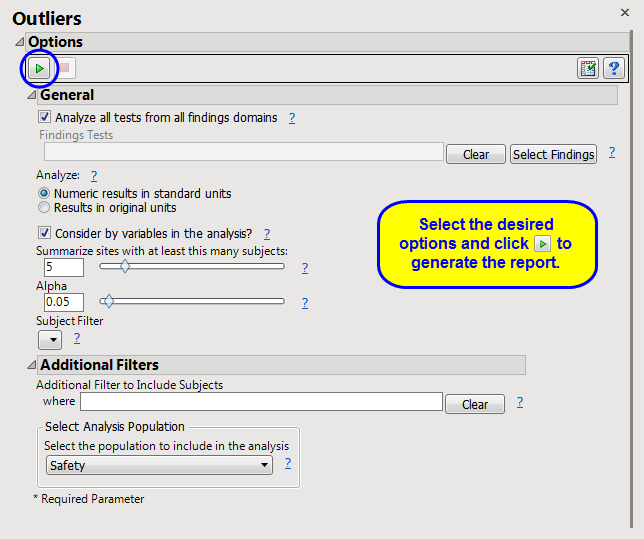
Analyze all tests from all findings domains
,
Findings Tests
,
Analyze:
,
Consider BY variables in the analysis
Where
xx
is the two-letter domain name.
Subject-specific filters must be created using the
Create Subject Filter
report prior to your analysis.
For more information about how to specify a filter using this option, see
The SAS WHERE Expression
.