Note
: JMP Clinical uses a special protocol for data including non-unique Findings test names. Refer to
How does JMP Clinical handle non-unique Findings test names?
for more information.
Running this report with the
Nicardipine
sample setting generates the report shown below.
The
Report
contains the following elements:
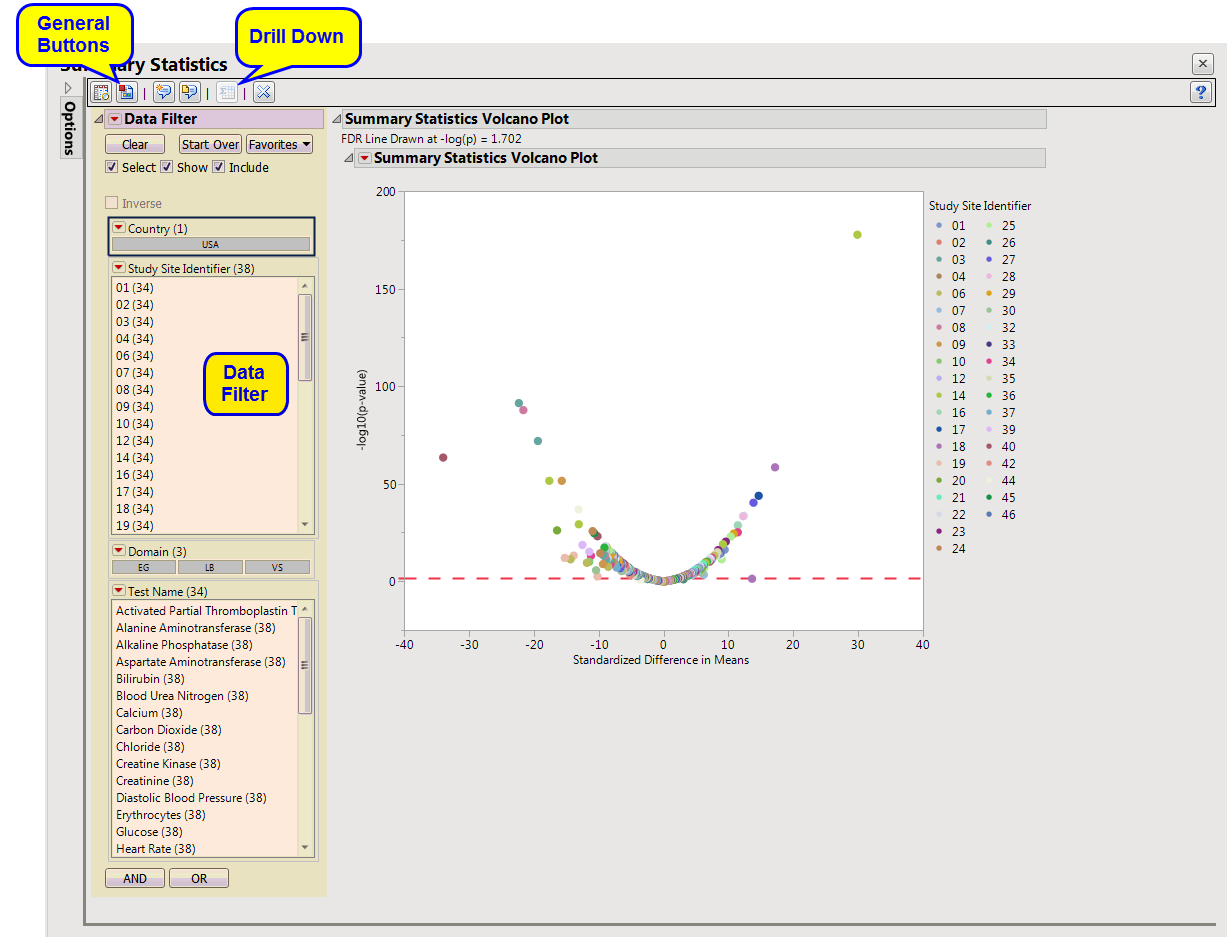
Shows a volcano plot used to determine the deviation of a mean or variance for Findings tests at a site versus other sites. Each point represents a single Findings test for a specific site. Here, the
X
axis represents the standardized difference in means between each between the site and the reference set (all other sites). For comparisons of variances, the
X
axis represents the
log
2
(Ratio of Variances) between the site and the reference set.
|
•
|
One
Data Filter
.
|
Enables you to subset subjects based on country of origin, study site and/or Test. Refer to
Data Filter
for more information.
|
•
|
The volcano plot is used to determine the deviation of a mean or variance for Findings tests at a site versus other sites. Each point represents a single Findings test for a specific site. Here, the
X
axis represents the standardized difference in means between each between the site and the reference set (all other sites). For comparisons of variances, the
X
axis represents the
log
2
(Ratio of Variances) between the site and the reference set.
-log
10
(
p
-values) are plotted on the
Y
axis. While most of the findings are close to the means across all of the sites. some of the points lie farther to the right or left of 0, indicating larger differences between the site and the reference set.
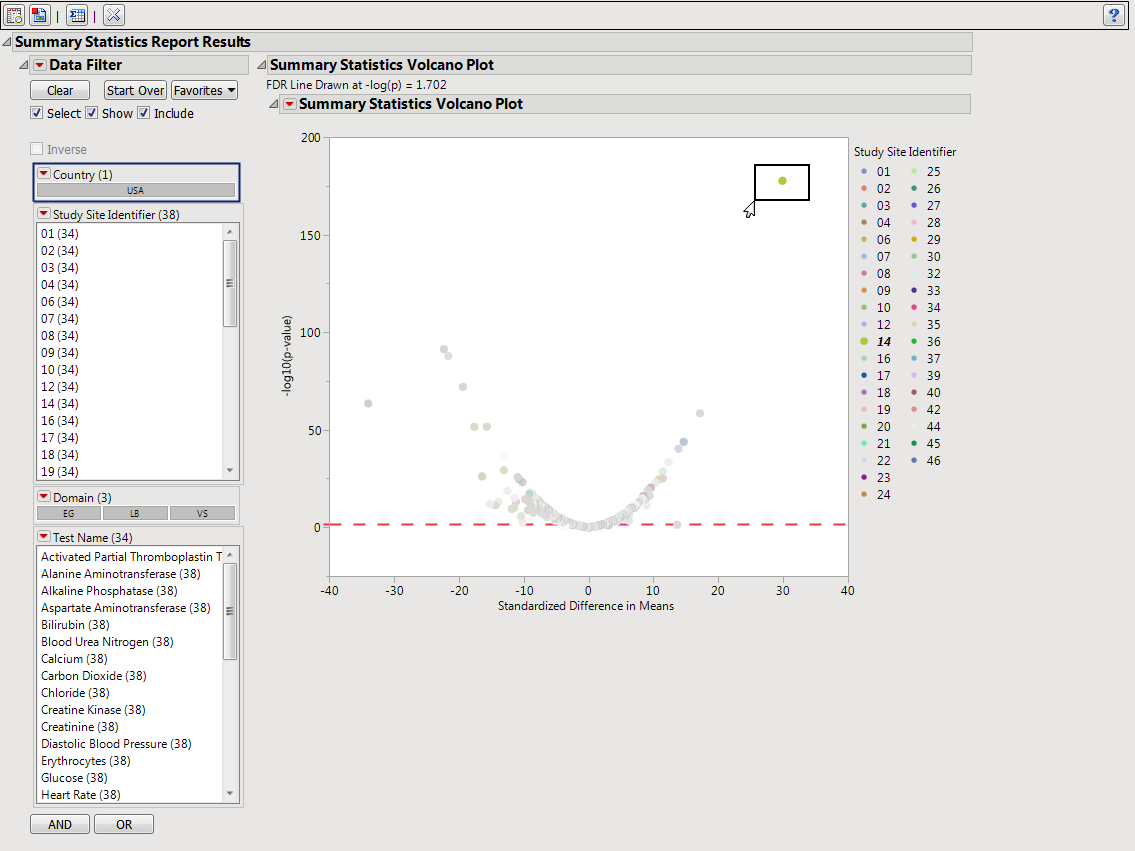
You can mouse over points of interest to see their labels or select points by dragging a mouse rectangle over them (as shown above). Selected rows are highlighted in other plots and you can also then click on various
Down Buttons
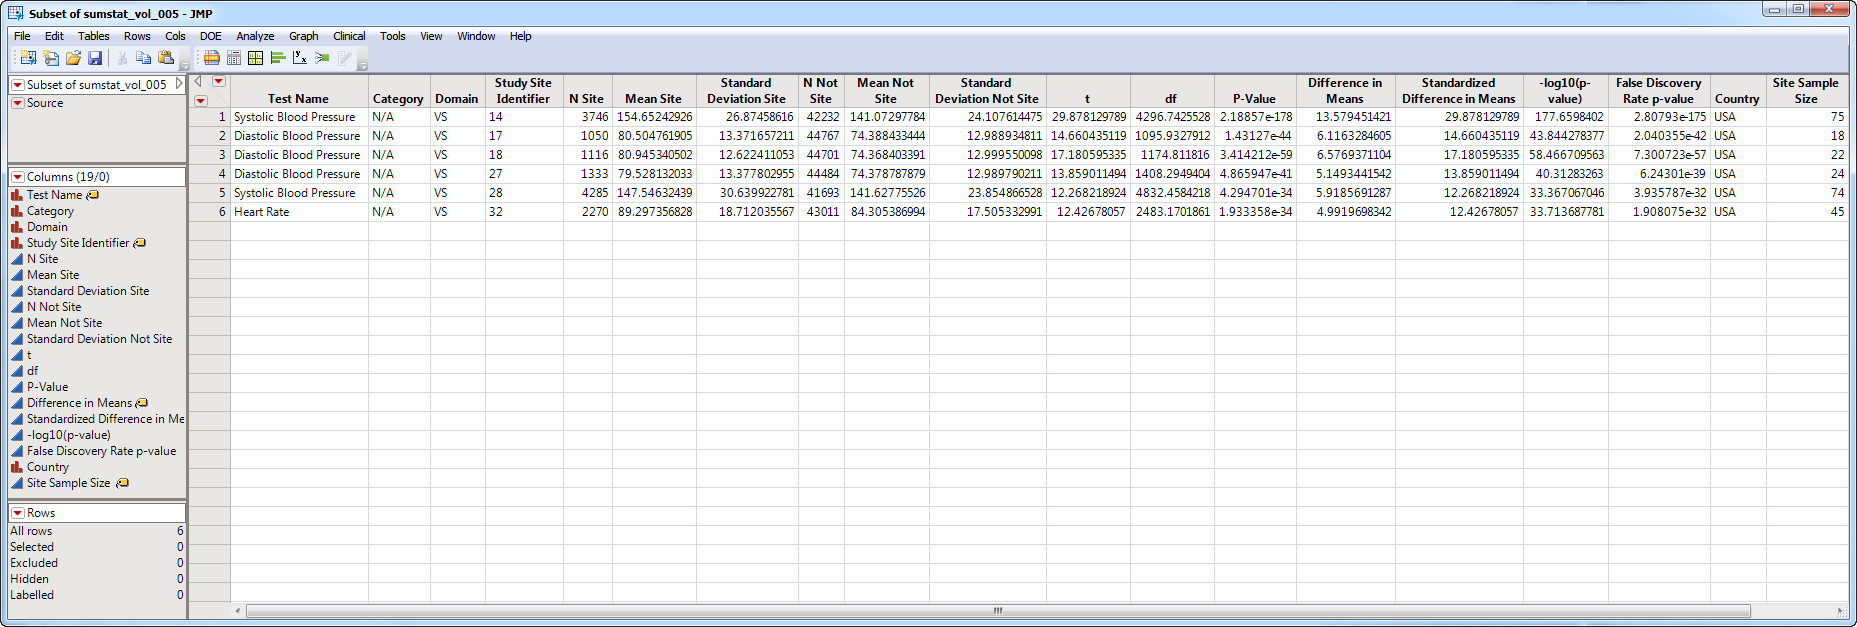
for further analyses on those specific sites. In this example, point skewed to the right is selected and the corresponding row is viewed in the following subset.
|
•
|
One
Data Filter
.
|
Enables you to subset subjects based on country of origin, study site and/or Test. Refer to
Data Filter
for more information.
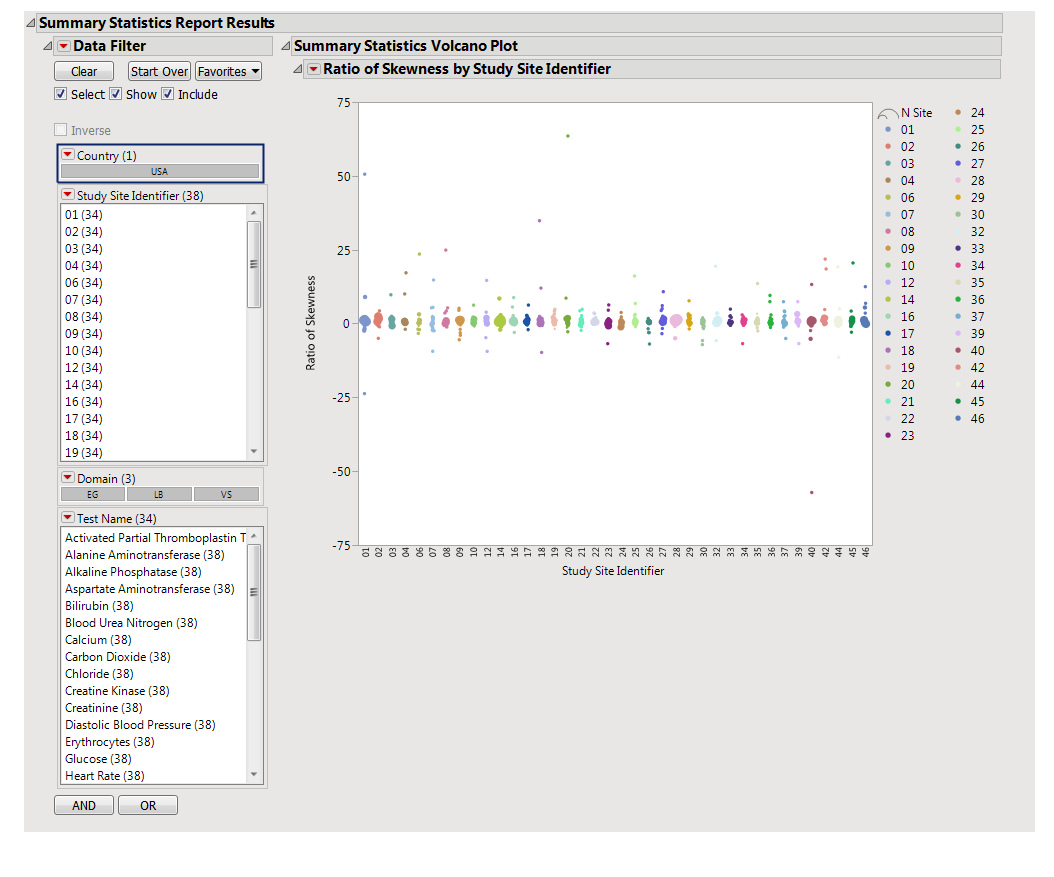
This plot shows the ratio of skewness or kurtosis from site to reference, with bubbles size by # of measurements. Values far from 1 on the
Y
axis indicate large differences, which might warrant further exploration, though bubbles of small size (low sample size) might represent random noise.
You can mouse over points of interest to see their labels or select points by dragging a mouse rectangle over them (as shown above). Selected rows are highlighted in other plots and you can also then click on various
Down Buttons
for further analyses on those specific sites.
|
•
|
Show Summary Statistics
: Shows the rows of the data table for the selected points from the
volcano plot
. Clicking
|

|
•
|
Click
|
|
•
|
Click
|
|
•
|
Click
|
|
•
|
Click
|
|
•
|
Click the
arrow to reopen the completed report dialog used to generate this output.
|
|
•
|
Click the gray border to the left of the
Options
tab to open a dynamic report navigator that lists all of the reports in the review. Refer to
Report Navigator
for more information.
|
|
•
|
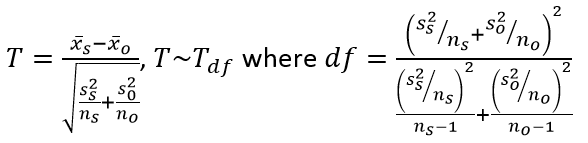
Mean
- An unpaired
t
-test assuming unequal variances between the groups is used.
|
FDR
p
-values are calculated and the reference line is determined as described in
How does JMP Clinical calculate the False Discovery Rate (FDR)?
.
|
•
|
Variance
- A test of unequal variance is
|
|
•
|
Skewness
and
Kurtosis
- No statistical tests are performed.
|

Analyze all tests from all findings domains
,
Findings Tests
,
Analyze:
,
Consider BY variables in the analysis
Summarize sites with at least this many subjects:
,
Analyze for:
,
Generate summary statistics by visit
,
Remove unscheduled visits
Subject-specific filters must be created using the
Create Subject Filter
report prior to your analysis.
For more information about how to specify a filter using this option, see
The SAS WHERE Expression
.