This report generates an exposure plot for all subjects in a study for an investigational product by dose and exposure time for the safety
population
by treatment. Summaries of exposure duration for subjects are also produced along with a static report of counts of total duration periods for subjects. The duration report and summary can be produced for specific duration times only through use of a duration time s list on the
Exposure Duration
tab. The exposure plot is generated for all subjects across any time of exposure.
The
Report
contains the following elements:
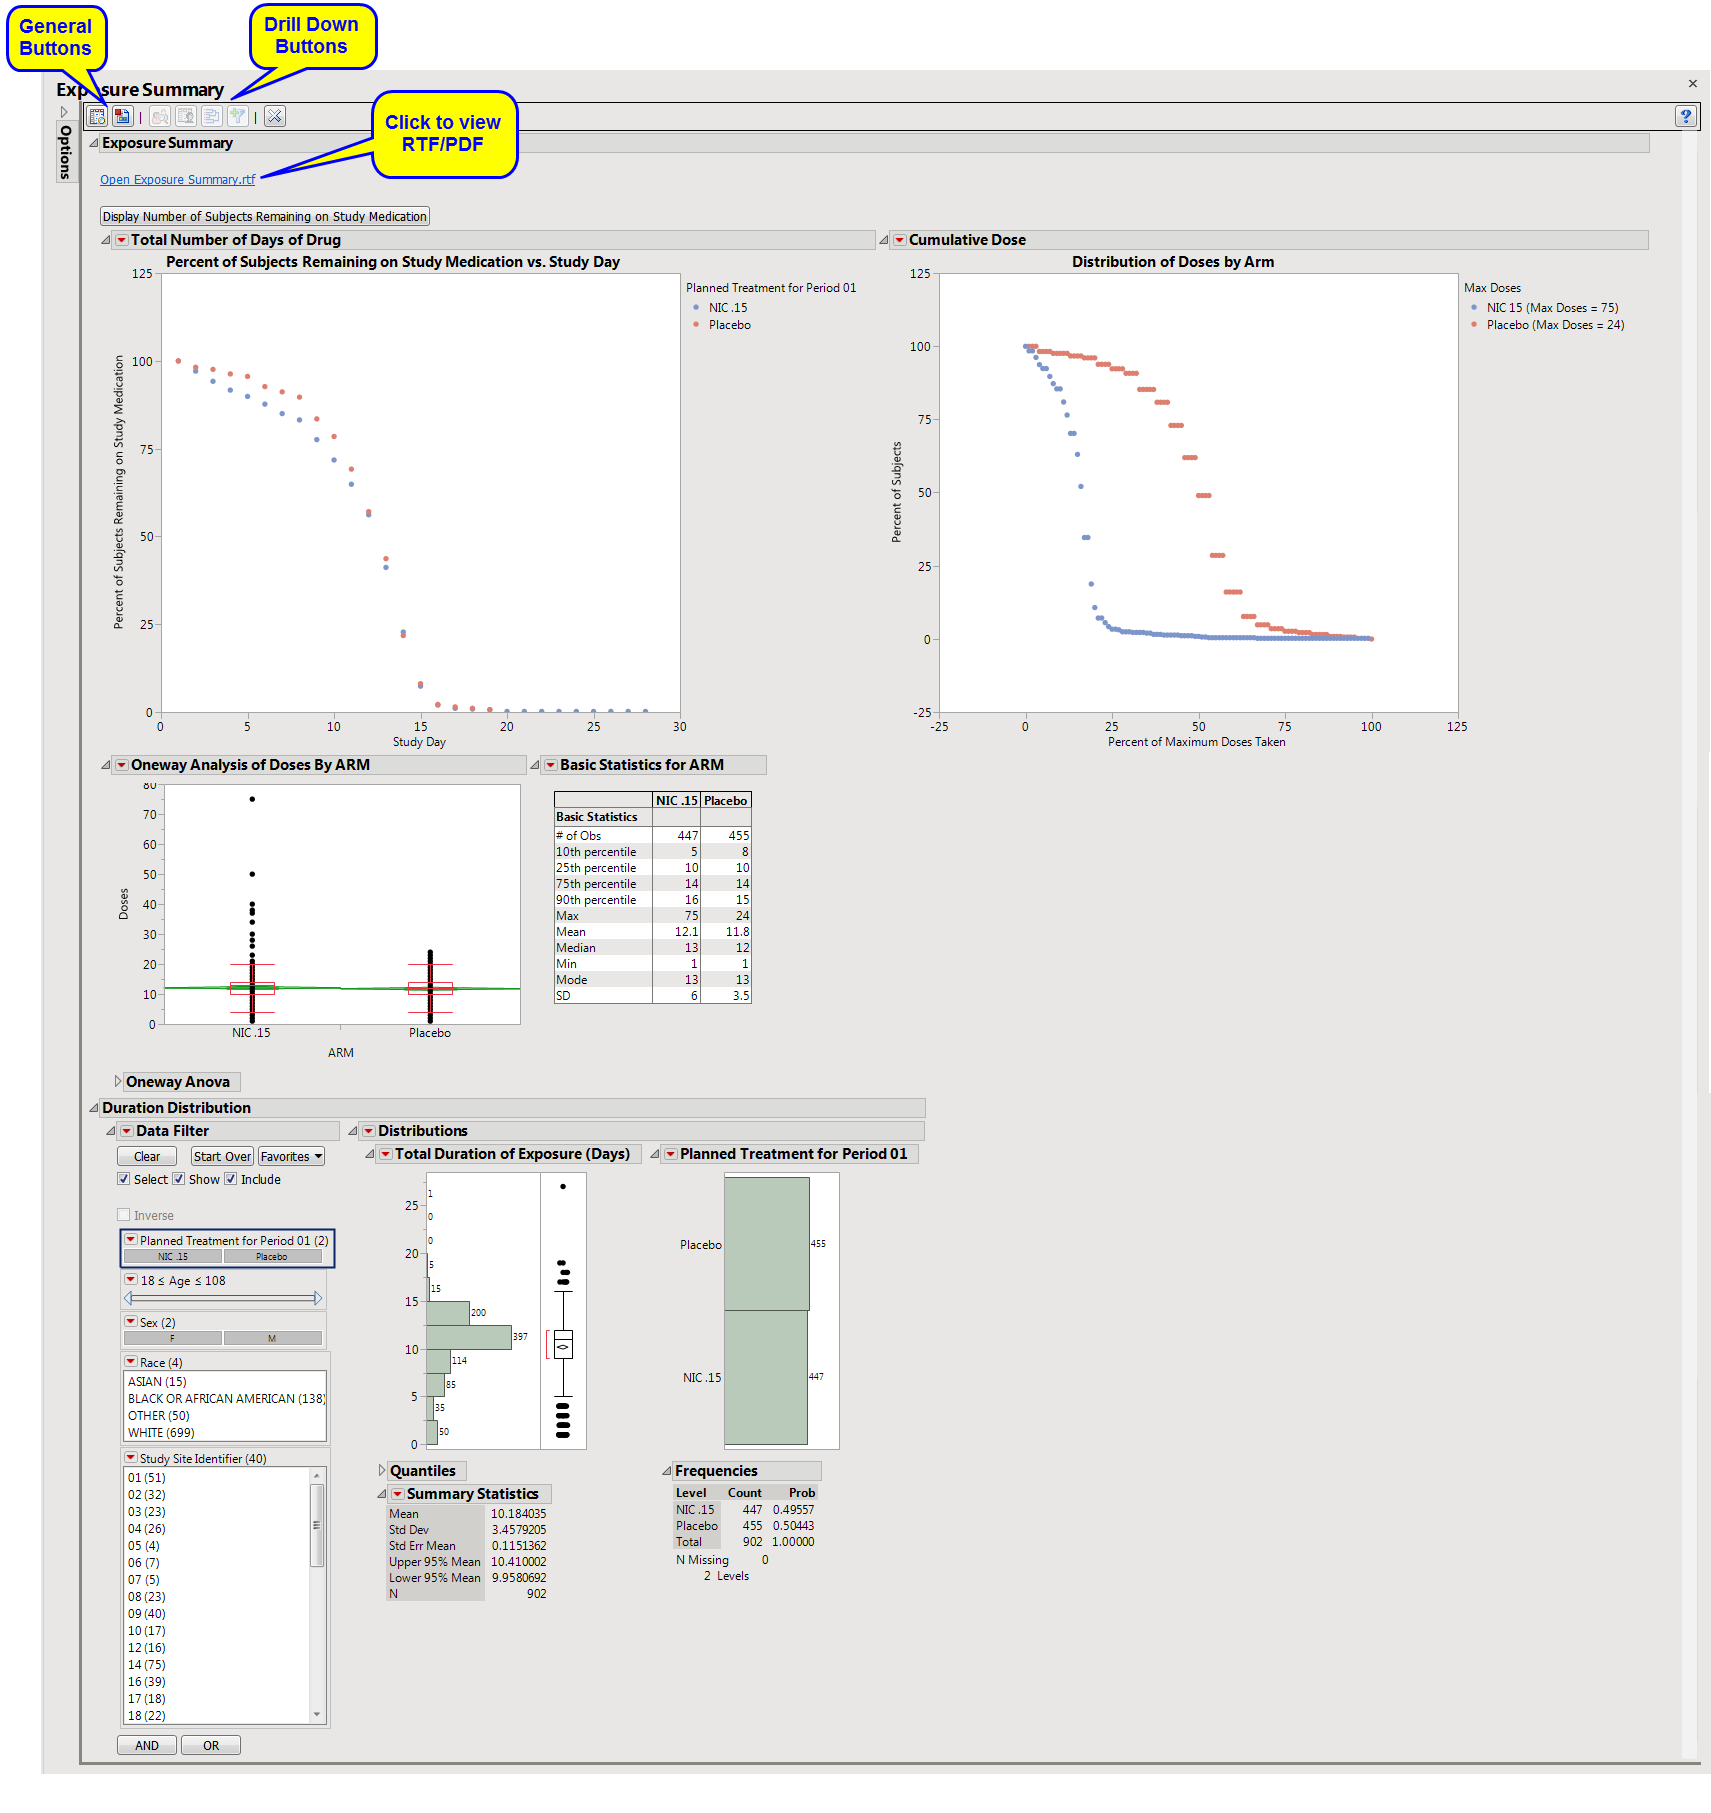
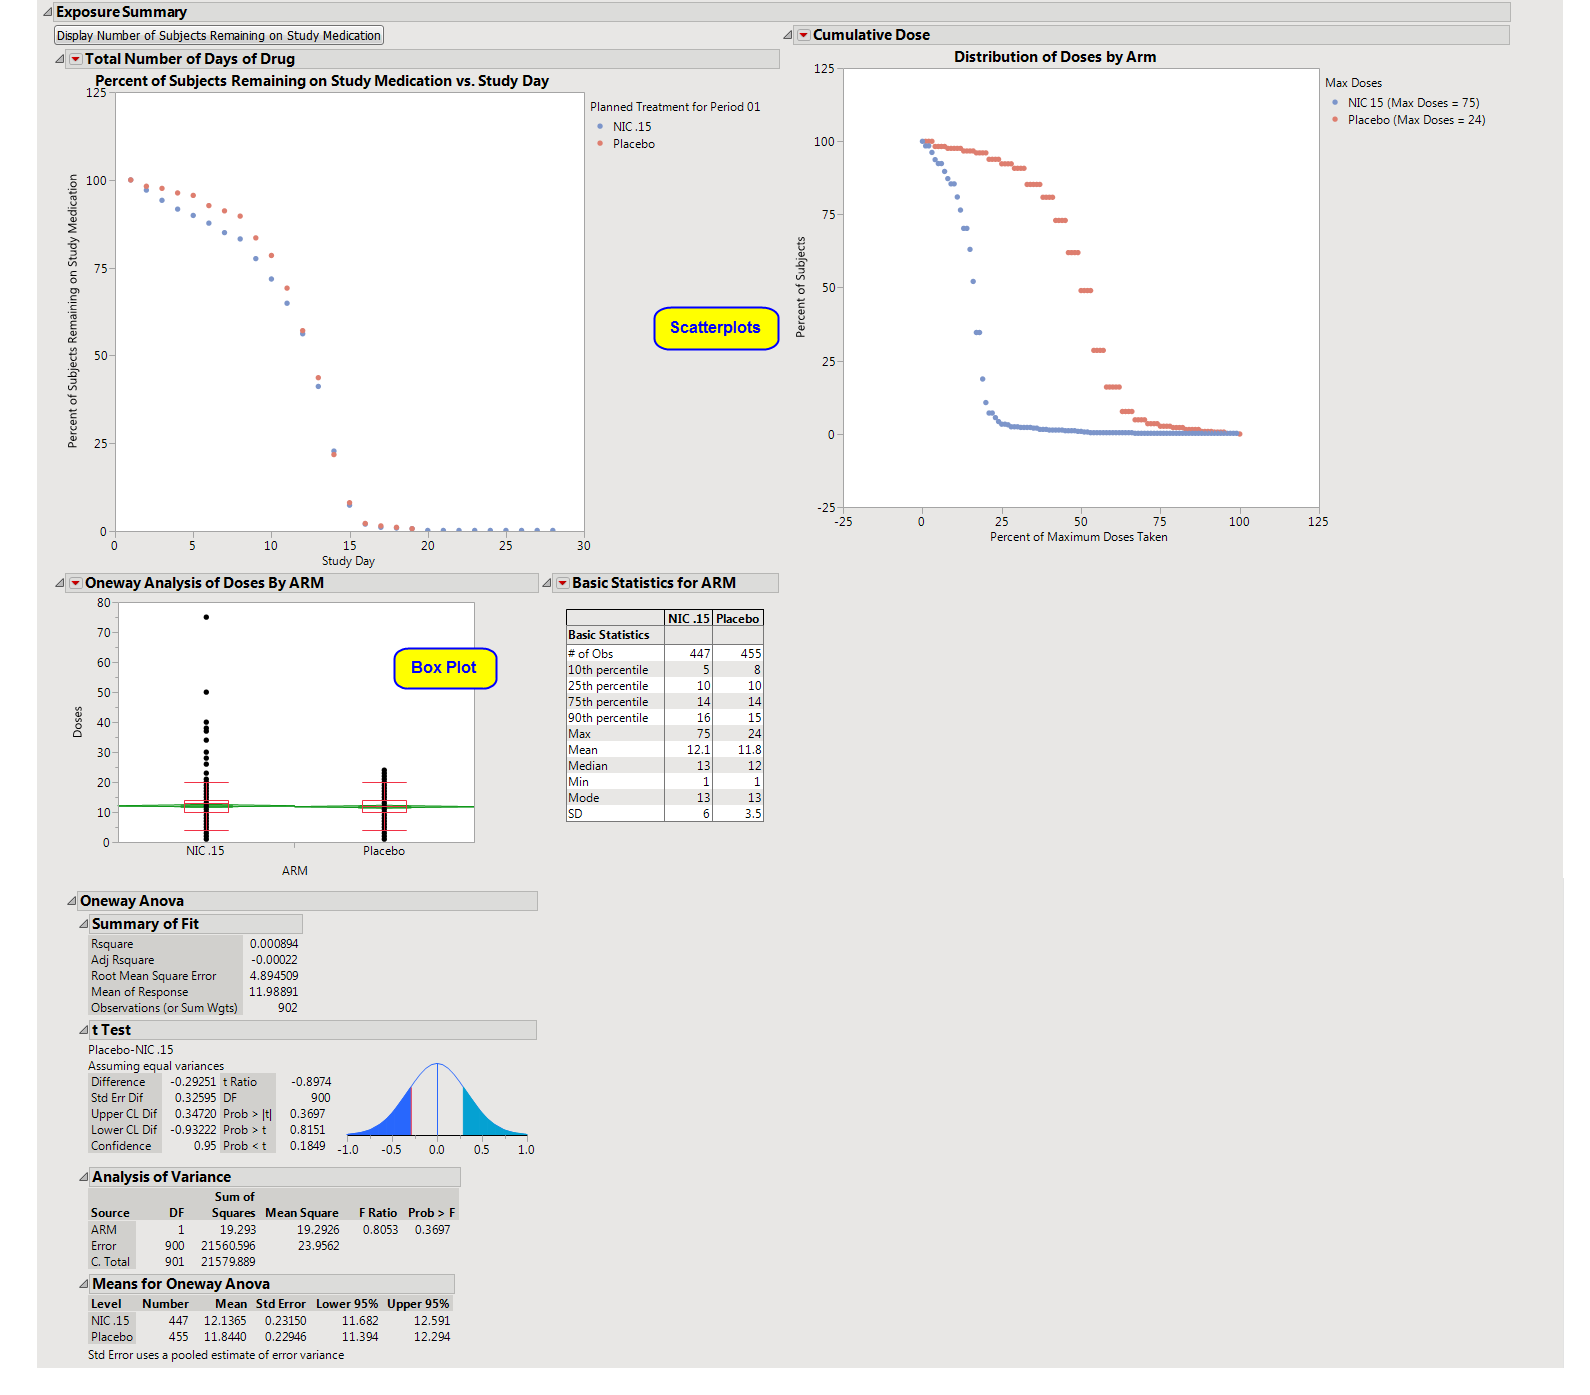
Displays three plots showing the percent of subjects who remain on the study medication by Day of Study, the
distribution
of doses by
arm
, and a list of dose descriptive statistics by ARM along with a
Box Plot
of doses.
|
•
|
The first shows the percentage of subjects remaining in each
arm
(plotted on the
Y
axis) on each assayed day of the study (plotted on the
X
axis). The percentages in each arm are calculated by using the number of remaining subjects assigned to that arm as the numerator and the total count of subjects who have been assigned to the arm as the denominator.
The second plot shows the
distribution
of doses among each arm's subjects in terms of a percentage of the maximum total number of doses received throughout the study in each treatment arm.
|
•
|
Box Plot
s and a table of descriptive statistics of the cumulative number of doses taken by treatment value.
|
Presents a
Histogram
for the total duration of exposure in terms of the number of days exposed to treatment.
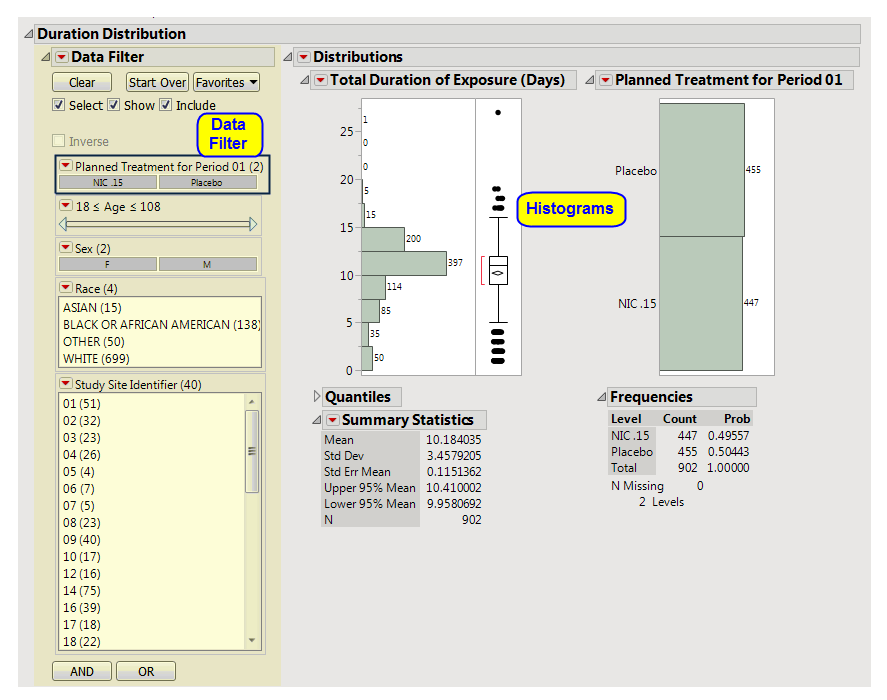
Presents a histogram for the total duration of exposure in terms of the number of days exposed to treatment. A second histogram summarizes the
distribution
of the treatment
variable
.
See
Distribution
for more information.
|
•
|
One
Data Filter
.
|
This enables you to subset subjects based on treatment, demographics, and study site. Refer to
Data Filter
for more information.
Note
: You can toggle between viewing percentage or number of subjects by clicking
.
|
•
|
Profile Subjects
: Select subjects and click
|
|
•
|
Show Subjects
: Select subjects and click
|
|
•
|
Cluster Subjects
: Select subjects and click
|
|
•
|
Demographic Counts
: Select subjects and click
|
|
•
|
Click
|
|
•
|
Click
|
|
•
|
Click
|
|
•
|
Click
|
|
•
|
Click the
arrow to reopen the completed dialog used to generate this output.
|
|
•
|
Click the gray border to the left of the
Options
tab to open a dynamic report navigator that lists all of the reports in the review. Refer to
Report Navigator
for more information.
|
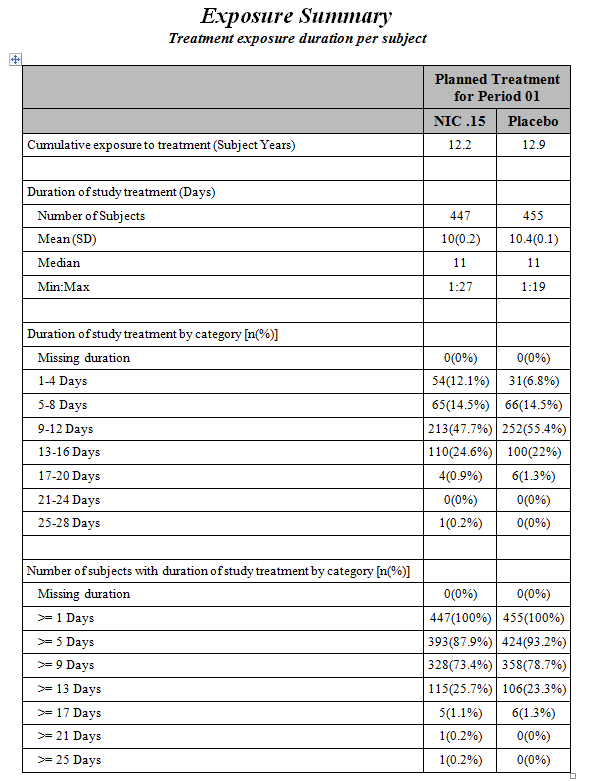
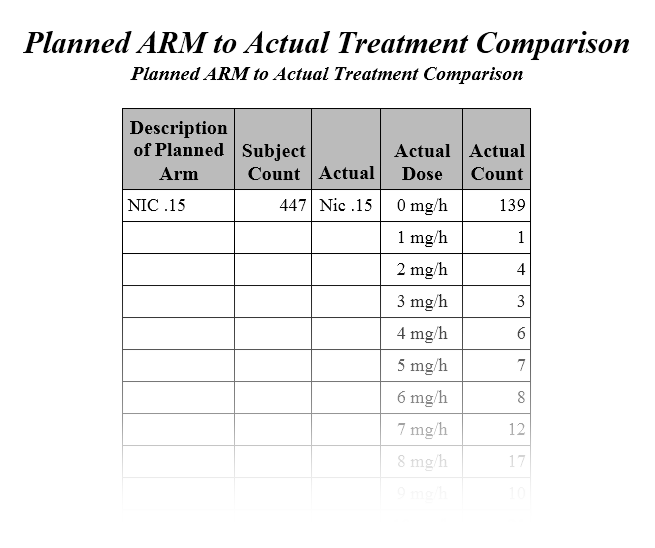
An
Exposure Summary Report
is also generated. Click the
Open Exposure Summary
link to view this report. It summarizes the dosing in terms of Subject Years, presents summary statistics of subjects’ exposure to treatment, the frequency of subjects within exposure categories (number and range determined by
Number of Duration Time Windows
and
Duration Time Windows
in the dialog), and the cumulative frequency within exposure categories. If Exposure Duration (
EXDUR
) is missing and end date/time of treatment (
EXENDT
) is incomplete or missing for a subject(s), the subject(s) are excluded from the min/max duration times in the report.
|
•
|
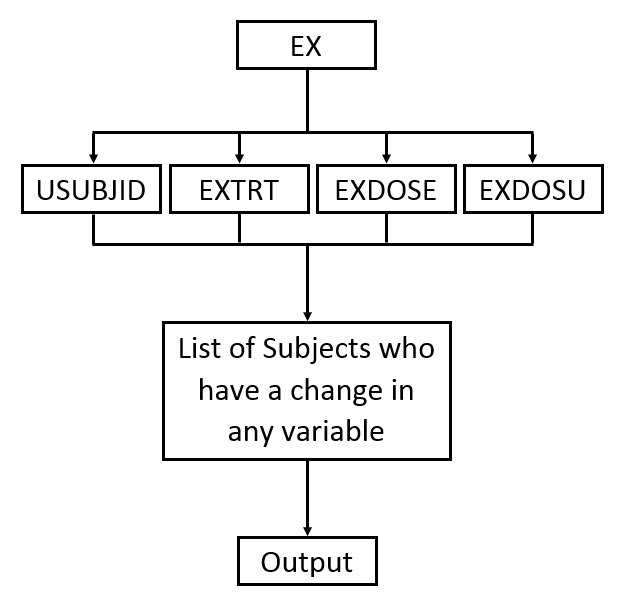
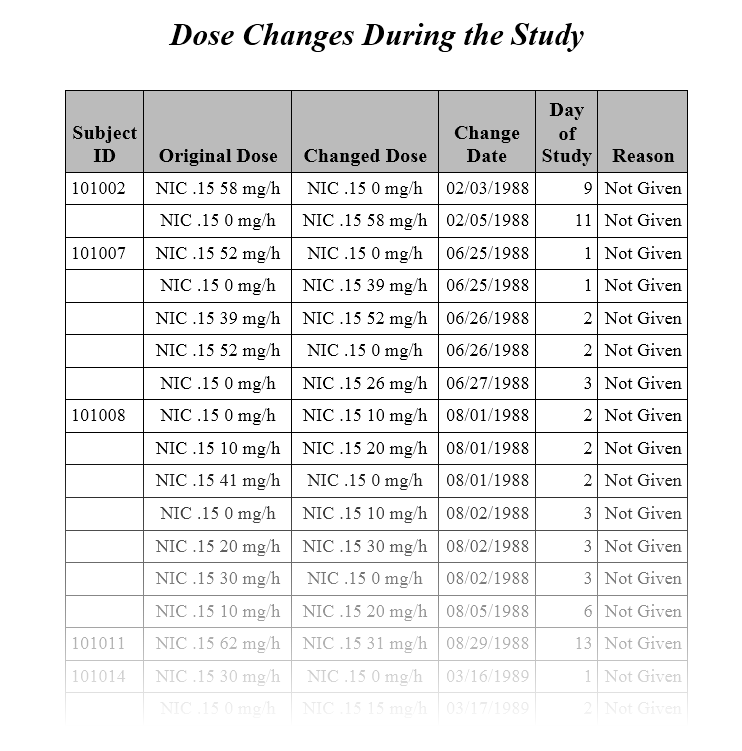
The second Table (shown below) lists the changes in dosage each subject received over the course of the study. JMP Clinical uses data from
USUBJID
,
EXTRT
,
EXDOSE
, and
EXDOSU
to generate the list of subjects with dosage changes reported in the table (as shown in the diagram below).
|
The original dose and the changed dose are calculated using combined data from
EXTRT
/
EXDOSE
/
EXDOSU.
The date and reason the dosage was changed are provided by
EXENDTC
and
EXADJ
. The default response of
Not Given
is shown whenever
EXADJ
is either empty or non-existent.
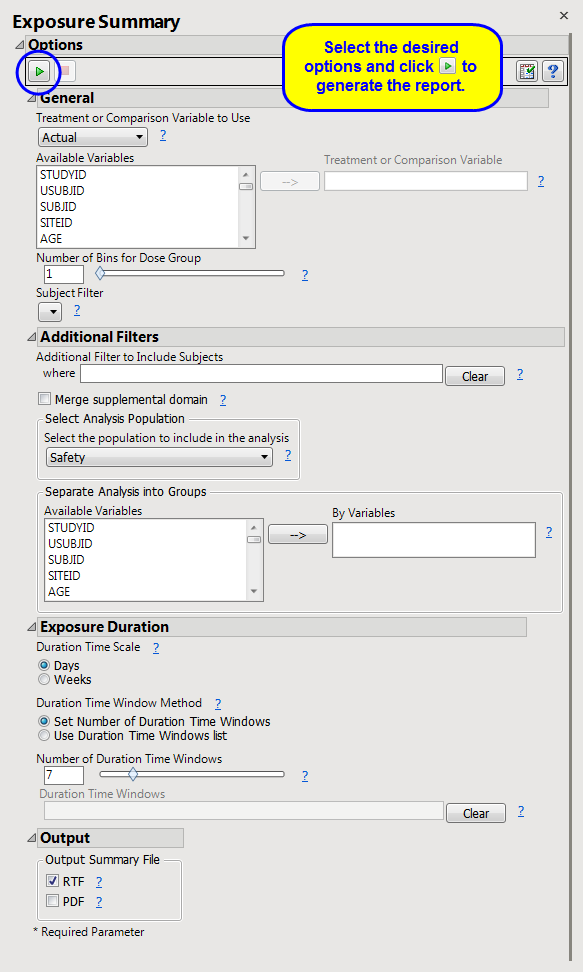
Treatment or Comparison Variable to Use
,
Treatment or Comparison Variable
,
Number of Bins for Dose Group
Additional Filter to Include Subjects
2
,
Merge supplemental domain
,
Select the population to include in the analysis
,
By Variables
Duration Time Scale
,
Duration Time Window Method
,
Number of Duration Time Windows
,
Duration Time Windows
Subject-specific filters must be created using the
Create Subject Filter
report prior to your analysis.
For more information about how to specify a filter using this option, see
The SAS WHERE Expression
.