This report adds data for various domains to the
adsl.sas7bdat
table corresponding to incidence of
variables
in the
AE
,
CM
,
LB
, and
MH
domains and a summary statistic for
LB
,
EG
, and
VS
domain values. The report converts all
character variables
with values
N
and
Y
to
numeric variables
with values
0
and
1
, respectively. The resulting output data set is suitable for pattern discovery and predictive modeling. A transposed version of the data set is also produced. Both versions are useful for
clustering
.
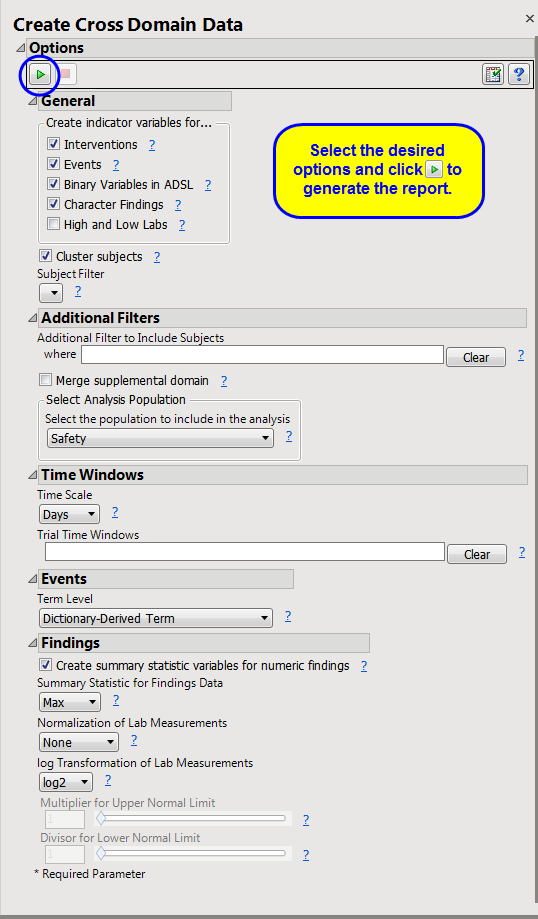
Running this report with the
Nicardipine
sample setting generates the
Results
shown below. Output from the report is organized into sections. Each section contains one or more plots, data panels, data filters, or other elements that facilitate your analysis.
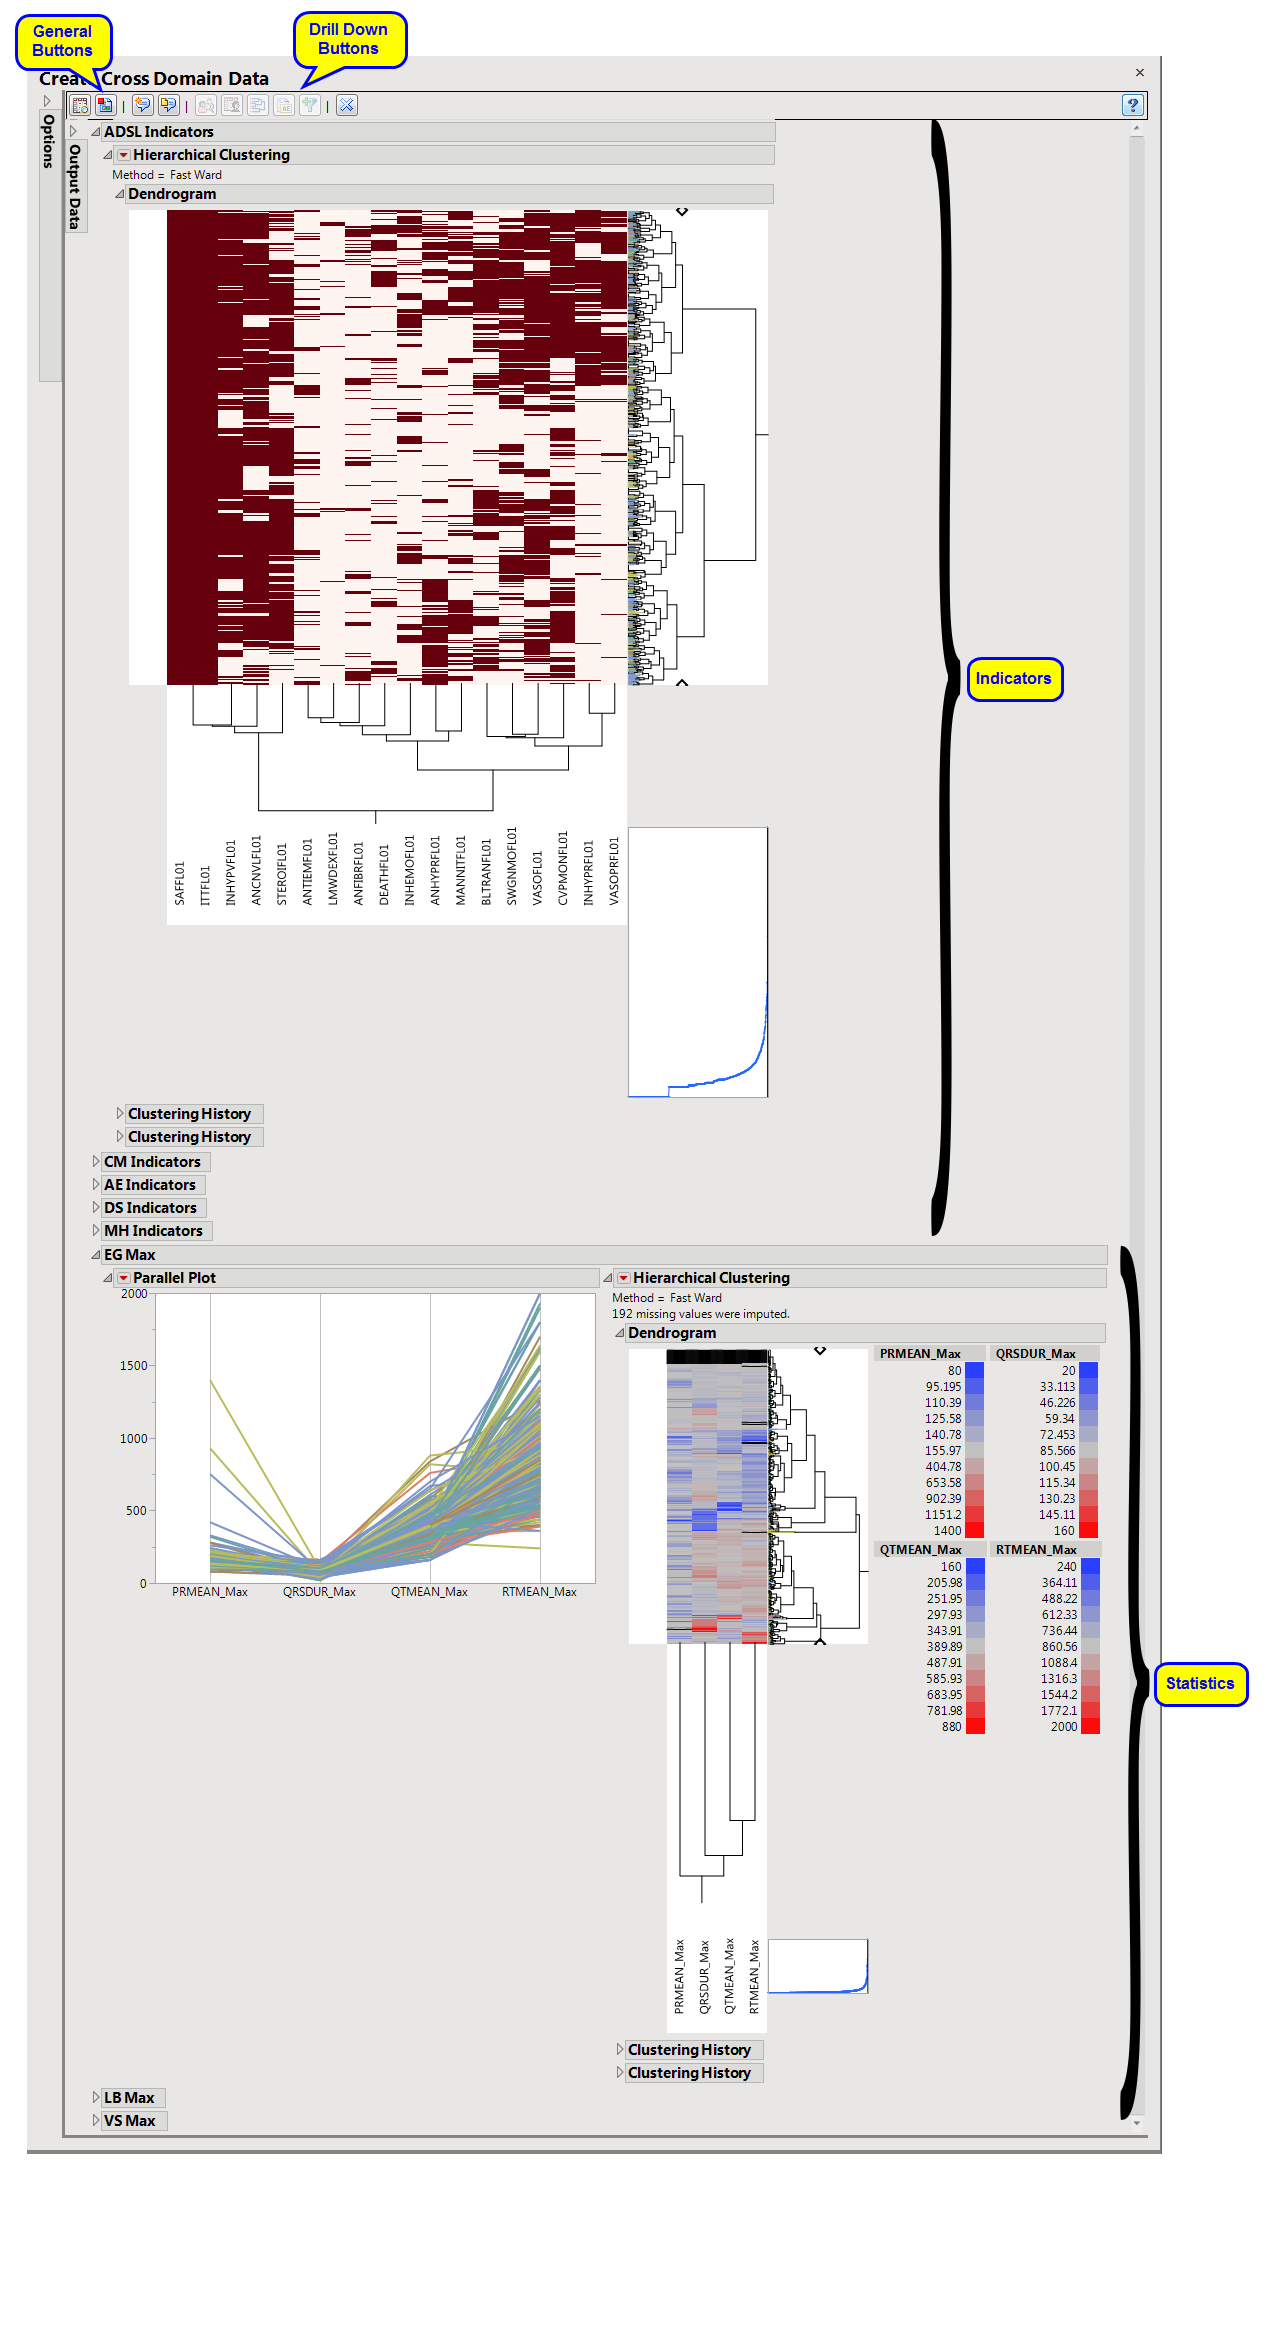
The
Create Cross Domain Data
report initially shows two sections
Indicators
and
Statistics
. Use the available options in each section to drill-down into the data.
Hierarchically clusters all binary indicator
variables
. A separate section is created for
each
domain (
ADSL
(
AD
), Concomitant Medications (
CM
),
Adverse Events
(
AE
), Disposition (
DS
), Medical History (
MH
), and Laboratory Test Results (
LB
)) that has
binary variables
, depending on the options selected. The binary variables are converted to 0s and 1s and clustered.
The
AD Indicators
section is shown below:
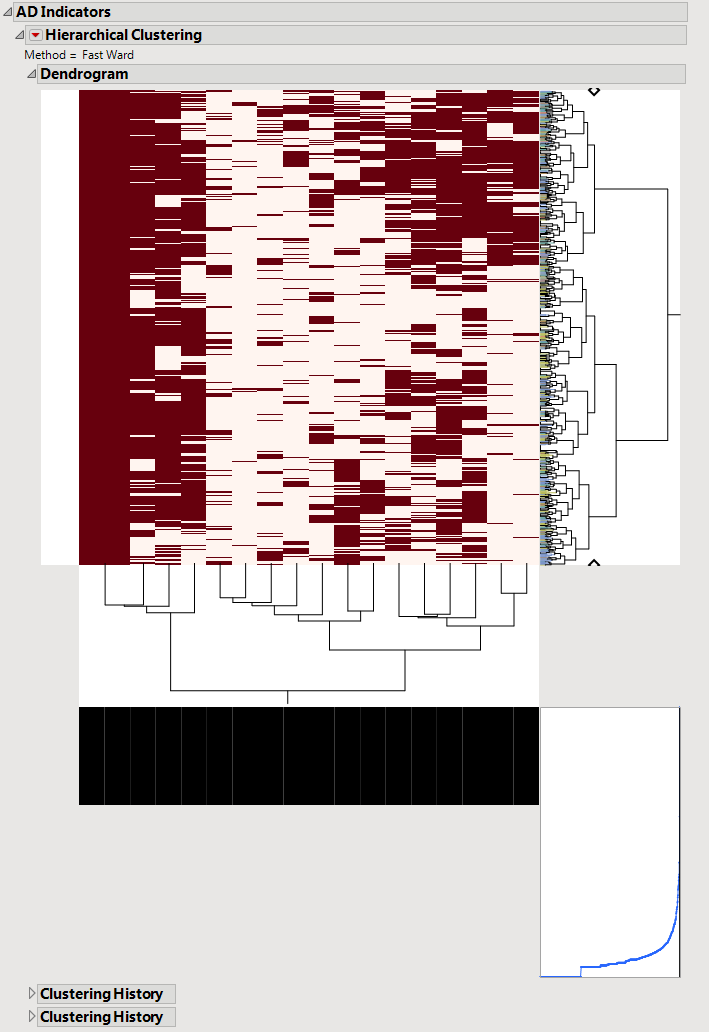
An
Indicator
section contains the following elements:
|
•
|
A two-way
hierarchical clustering
analysis of the 0-1
variables
, with subjects as rows and indicator variables as columns.
|
You can study the
Heat Map and Dendrogram
to see both subjects that have similar values of the binary variables as well as binary variables that are similar across subjects.
See the JMP
Hierarchical Clustering
platform for more information.
Hierarchically clusters a statistic computed on continuous variables. A separate section is created for
each
domain (ECG Test Results (
EG
), Laboratory Test Results (
LB
), and Vital Signs (
VS
)) that has continuous variables.
The
EG Max
section is shown below:
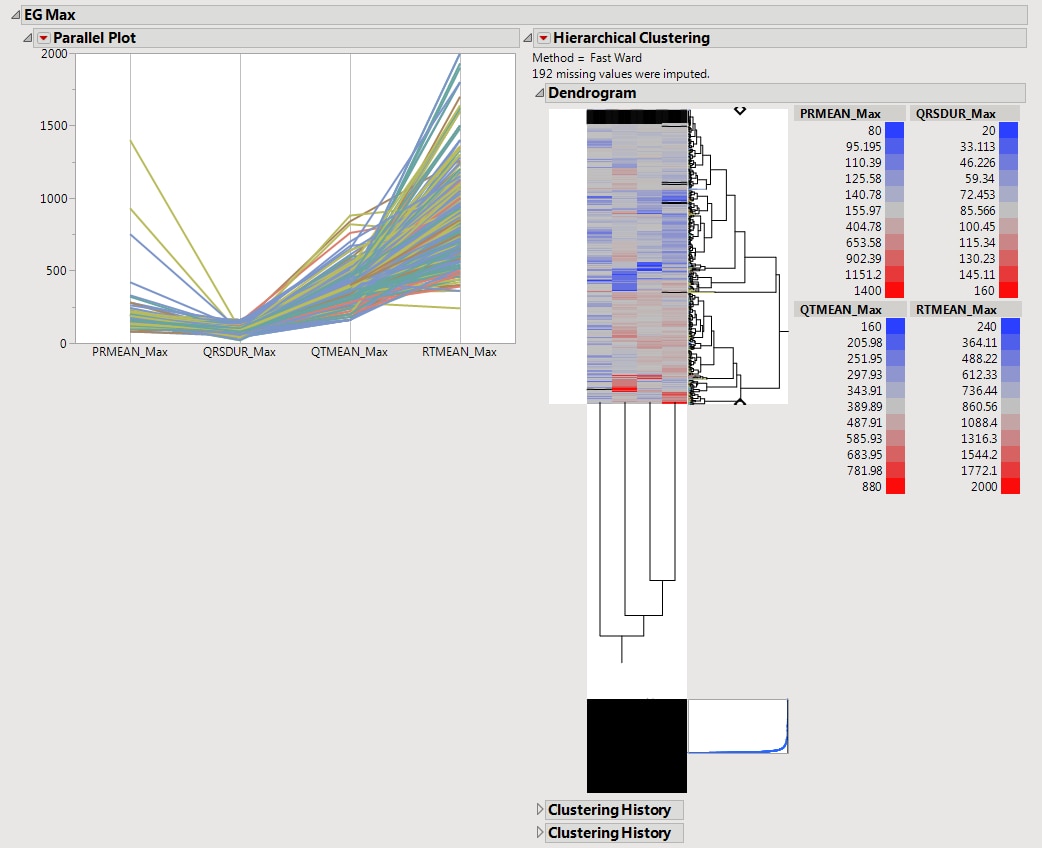
This shows a
Parallel Plot
of the computed statistic for each
variable
in the domain. Each line in the plot corresponds to a subject. In the example above, the
max
statistic is plotted for four variables. The coloring of the lines comes from the
hierarchical clustering
analysis of the first numeric domain.
See the JMP
Parallel Plot
platform for more information.
See the JMP
Hierarchical Clustering
platform for more information.
|
•
|
Transposed Subject Data
(
adsl_cddt.sas7bdat
): This data set is the transpose of the main output table. The transposed table has domain data identifiers as rows and subjects as columns.
|
|
•
|
Profile Subjects
: Select subjects and click
|
|
•
|
Show Subjects
: Select subjects and click
|
|
•
|
Cluster Subjects
: Select subjects and click
|
|
•
|
Demographic Counts
: Select subjects and click
|
|
•
|
Click
|
|
•
|
Click
|
|
•
|
Click
|
|
•
|
Click
|
|
•
|
Click the
arrow to reopen the completed report dialog used to generate this output.
|
|
•
|
Click the gray border to the left of the
Options
tab to open a dynamic report navigator that lists all of the reports in the review. Refer to
Report Navigator
for more information.
|
Subject-specific filters must be created using the
Create Subject Filter
report prior to your analysis.
For more information about how to specify a filter using this option, see
The SAS WHERE Expression
.