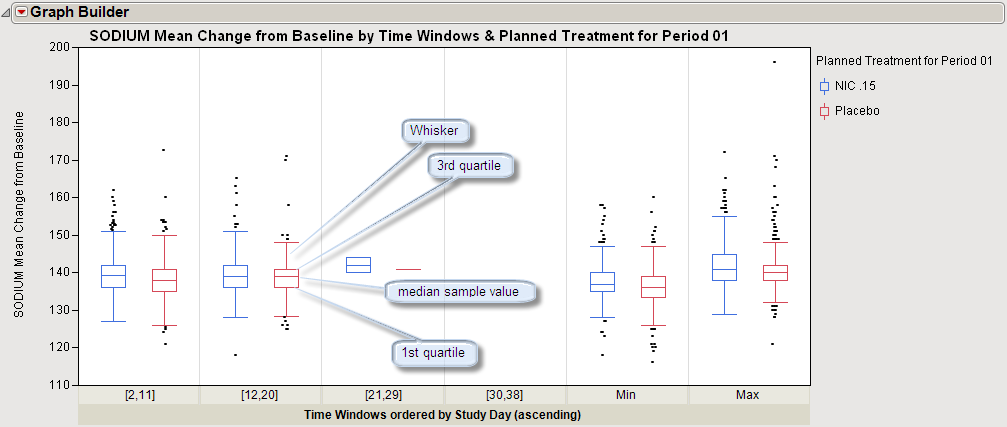
A
box plot
(also known as a box-and-whisker plot) provides information about the
mean
, variability, outliers, and symmetry of the
distributions
of your data.
|
•
|
The plot consists of a box that extends from the 25th
quantile
(also known as the first (Q1) quartile) to the 75th quantile (also known as the third (Q3) quartile).
|