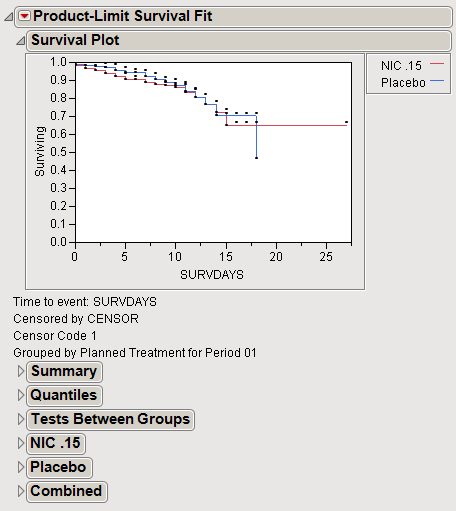
A
survival plot
summarizes the survival of patients in each experimental
arm
over the course of a clinical trial.
The time period of the study is plotted on the
X
axis and the proportion of survivors for each arm is plotted on the
Y
axis.
